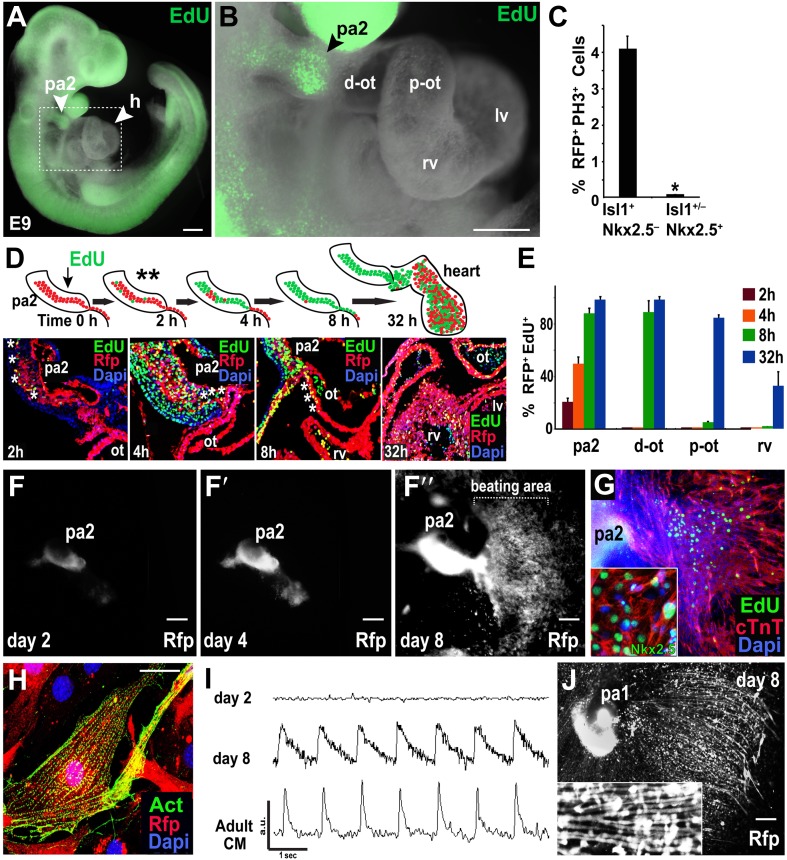
Figure 3. Mesp1+ progenitor-derived Isl1+ Nkx2.5– cells expand in PA2 and differentiate into Nkx2.5+ heart cells after leaving PA2.
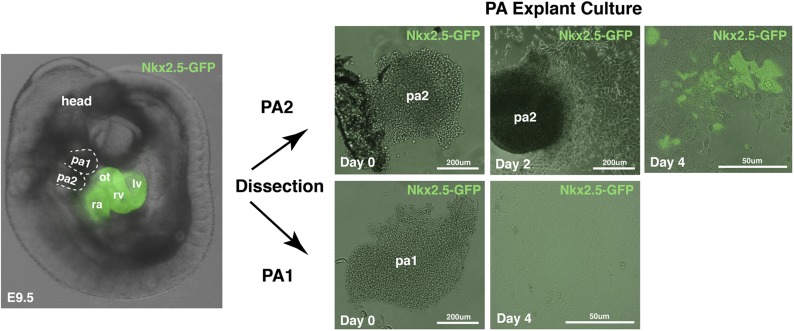
(A) Whole-mount view of EdU (green)-treated embryo at E9.0. (B) Enlargement of the boxed area in (A), showing enrichment or lack of EdU+ cells in the PA2 or heart region, respectively. (C) Percentage of RFP+ PH3+ cells in Isl1+ Mef2c−Nkx2.5− cells and Isl1+/− Mef2c+ Nkx2.5+ cells. Data are mean ± SD; n = 4. (D) EdU pulse experiment. Top, EdU experiment schema. PA2s were also dissected out for ex vivo culture after 2 hr (**). Bottom, progeny of EdU+ cells at 2, 4, 8, and 32 hr after single pulse of EdU injection at E9.0 demonstrating that Mesp1 progeny in PA2 proliferate and migrate to form the OT/RV. (E) Quantification of RFP+ EdU+ cell progeny shown in (D). Data are mean ± SD; n = 3. (F–F″), Cultured PA2 explants in 2D culture form a sheet of beating cardiomyocytes (see Video 1). (G) EdU-pulsed PA2-derived sheet of beating cells stained with cTnT, EdU, or Nkx2.5 (inset). (H) Confocal image of RFP+ cells migrated from PA2 stained with cardiac α-actinin (Act). (I) Intracellular Ca2+ transients from day 2 and day 8 PA2 explants and adult cardiomyocyte (CM). a.u., arbitrary unit. (J) Cultured PA1 explants form myotube-like cells. Inset shows a magnified view. *p<0.05. D, day; Heart, E10.5 embryonic heart; ACTC1, actin, alpha, cardiac muscle 1. Dapi (blue) was used to counterstain the nuclei. p values were determined using the paired Student t-test. Scale bars, 10 μm (H), 150 μm (A and B), 250 μm (F–F″ and J). pa, pharyngeal arch; h, heart; d-ot, distal outflow tract; p-ot, proximal outflow tract; rv, right ventricle; lv, left ventricle.
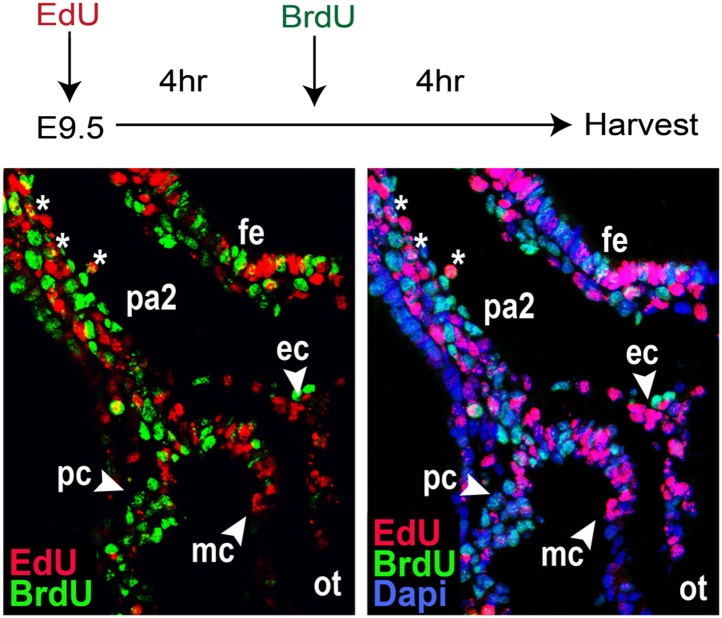
Figure 3—figure supplement 1. Dual Injection of EdU and BrdU.
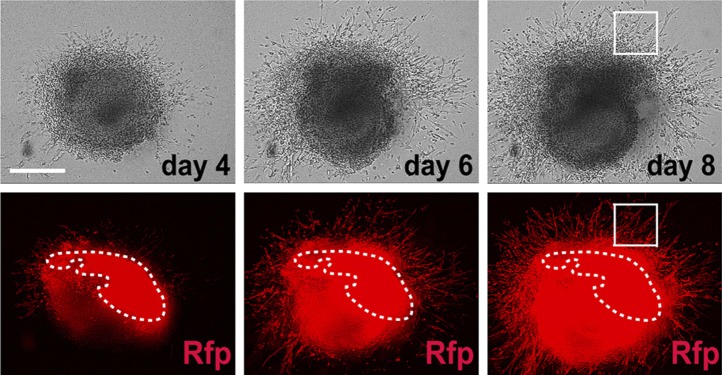
Figure 3—figure supplement 2. Time lapse images of 3-D matrigel PA2 culture.


