Figure 1.
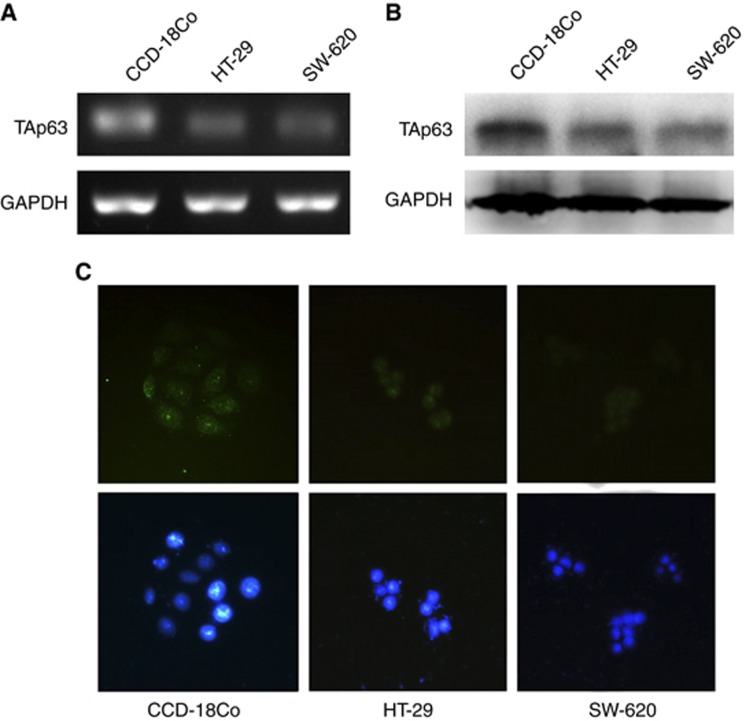
Expression of TAp63 in HT-29, SW-620 and CCD-18Co cells. The expression of TAp63 was analysed by RT–PCR, western blot and immunofluorescence. (A) Electrophoresis in 2% (w/v) agarose gel reveals a single 127-bp product following amplification by PCR using TAp63-specific primers. (B) Western blotting analysis of TAp63 on HT-29, SW-620 and CCD-18Co cells (top panel). The GAPDH loading control is shown in the bottom panel. (C) Immunofluorescence assay showed that TAp63 was present in the nuclei of HT-29, SW-620 and CCD-18Co cells. DAPI was used to counterstain the nucleus in blue, and TAp63 staining was in green. The figures show that the TAp63 expression level in HT-29 and SW-620 cells was much lower than that in CCD-18Co cells.

