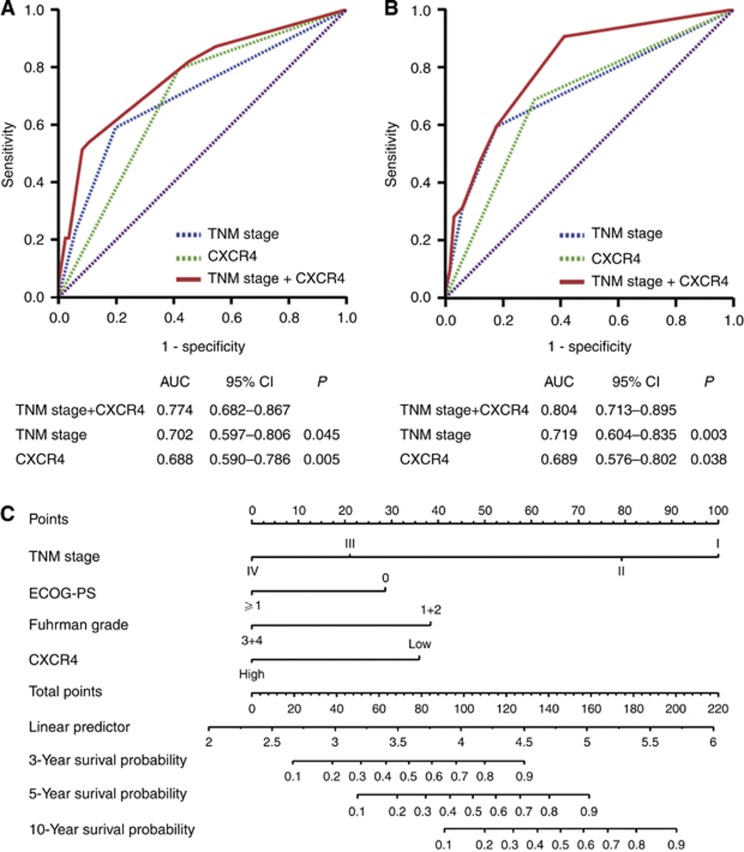
Figure 3.
ROC analysis and nomogram generation for the prediction of OS in patients with ccRCC. ROC analysis of the sensitivity and specificity for the prediction of OS in the training set (A), in the validation set (B) by the TNM stage and CXCR4 combined model, the TNM stage model, and the CXCR4 expression model. P-values show statistical significance of the AUC of the TNM stage and CXCR4 combined model, the TNM stage model, and the CXCR4 expression model. (C) Nomogram to predict risk of OS in training set.

