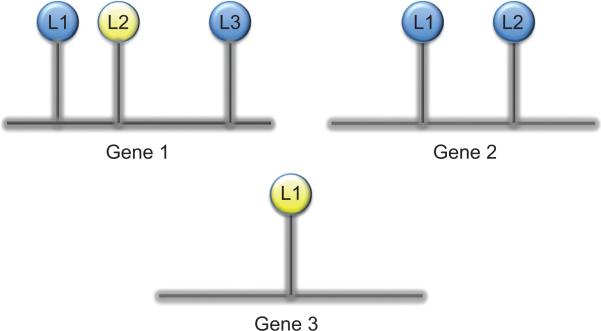
Figure 1.
Illustration of the assumed covariance structure for DNA methylation data. The methylation status was assessed for three CpG loci associated with Gene 1 (L1, L2, and L3), two CpG sites associated with Gene 2 (L1 and L2), and a single CpG site associated with Gene 3 (L1). We allow correlation between the methylation of CpG sites associated with the same gene, however assume the methylation status of CpG sites associated with different genes to be independent. Blue represents a methylated CpG site and yellow represents an unmethylated CpG site.

