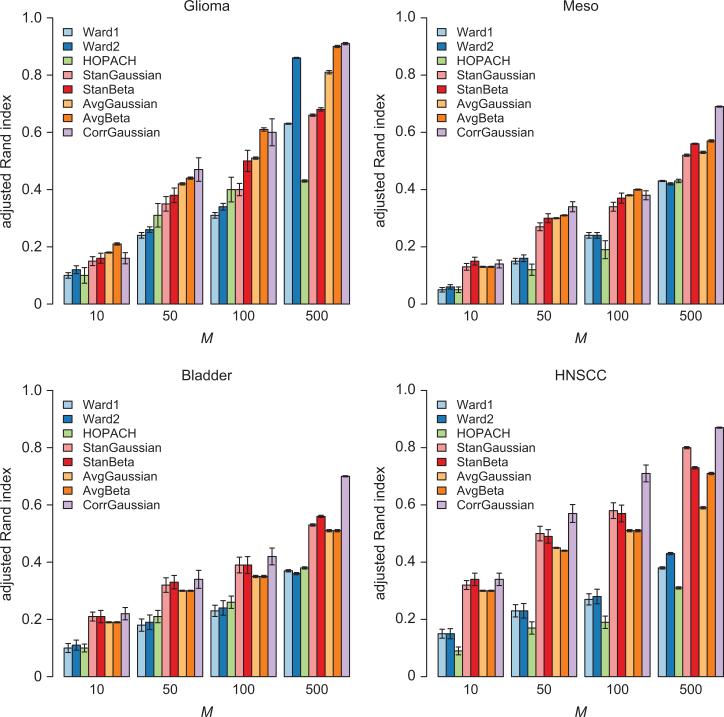
Figure 3.
Results comparing the clustering consistency of Ward1, Ward2, HOPACH, StanGaussian, StanBeta and CorrGaussian for M randomly selected genes. The adjusted rand-index represents the mean pairwise adjusted rand-index across 100 separate analyses. The 95% CI for the adjusted rand-index is displayed for each of the methods.

