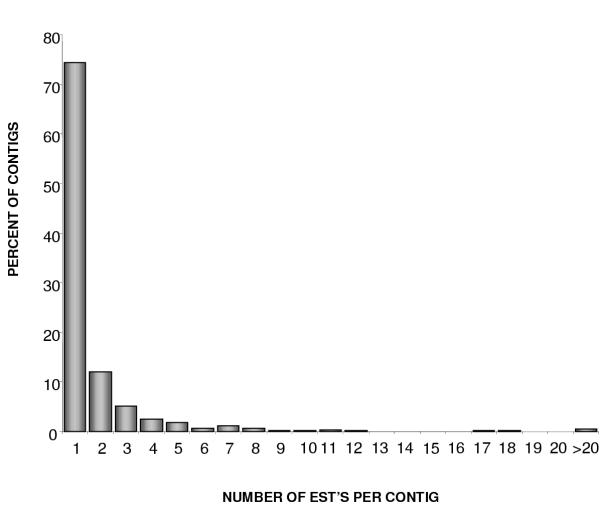
Figure 2.
Bar graph showing the redundancy rates of NSH-ESTs The NSH-ESTs were assembled into contigs and the number of ESTs per contig was determined, against which was plotted the percentage of contigs containing that number of NSH-ESTs. Seventy-five percent of the contigs are composed of one NSH-EST.

