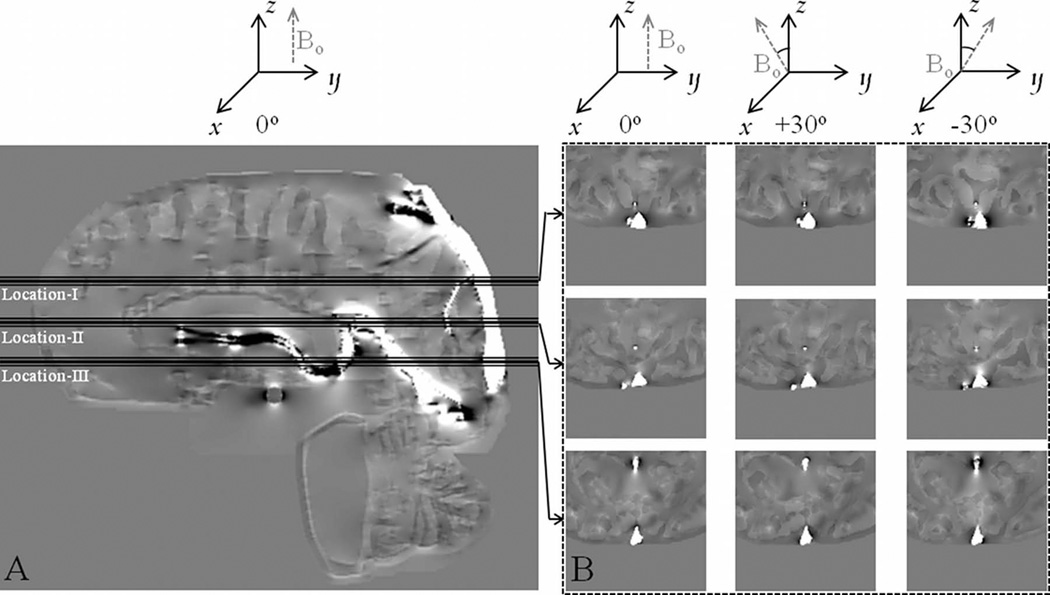
Figure 2.
Phase images from simulations with corresponding θ values as illustrated. Simulations were carried out for 3 different relative orientations of the axial slice-normal relative to Bo, i.e., three different θ values. A) Sagittal phase image illustrating the three locations where phase measurements for determination of Yv were carried out. B) Axial images corresponding to the central slice at the locations shown in (A). Images were zoomed by a factor of 4 and cropped to show phase in the SSS for the three different θ values of 0°, +30° and −30°.

