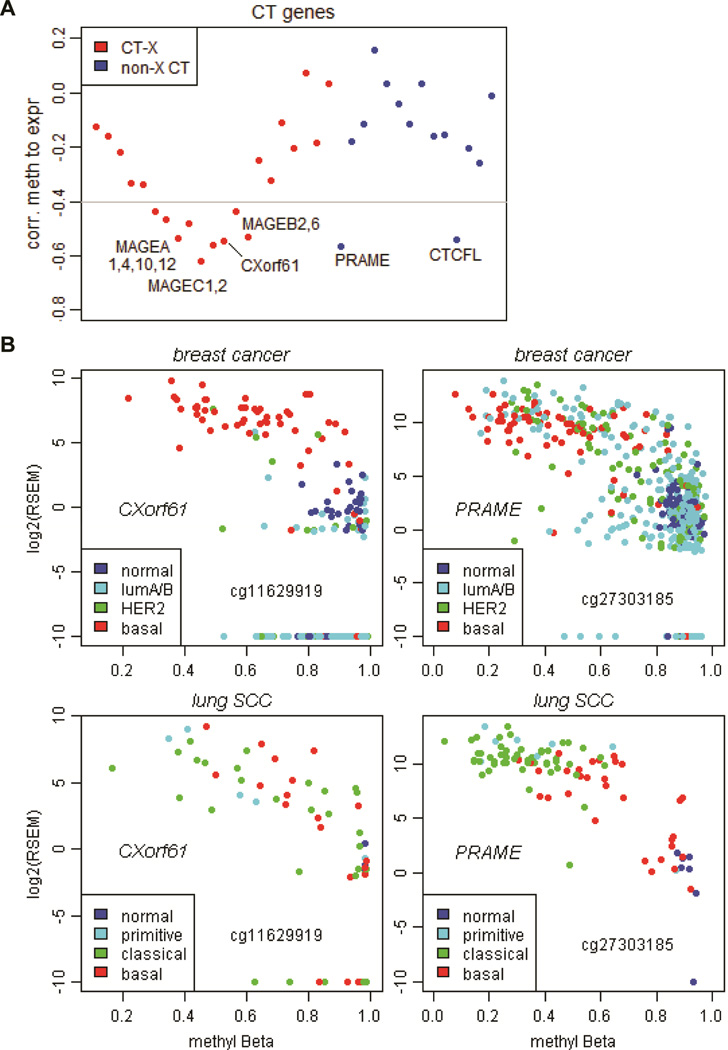
Figure 4.
Correlation of CT gene expression to DNA methylation. (A) Plot of the least median Pearson correlation coefficients between gene expression (using logged RNAseq RSEM values) and DNA methylation (using Met450 M values) for CT-X genes (red) and non-X CT genes (blue) (see Methods). (B) Scatter plots of CXorf61 and PRAME gene expression (logged RSEM values) versus DNA methylation (beta values) in breast cancers and lung squamous cell carcinomas. Samples were labeled in colors to mark different cancer subtypes as shown in the legend. Infinium Met450 probes under study were marked on the figure, which can be used to locate exact chromosomal coordinates of the DNA methylation sites.

