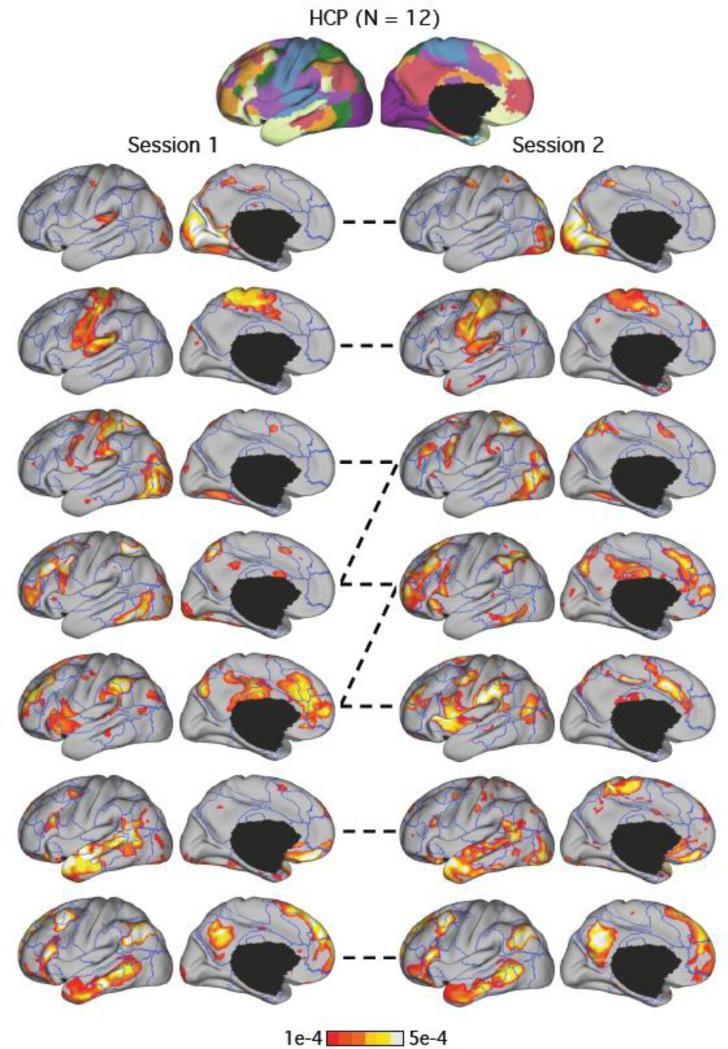
Figure 6.
Similar to Figure 6, LDA estimates of the HCP subject with the median test-retest reliability is displayed. Format is identical to Figure 6. The mean of the Pearson correlation coefficients of the seven pairs of network estimates was 0.61. The dotted lines indicate correspondences between the LDA networks across the two sessions. By visual inspection, the third, fourth and fifth networks in sessions 1 and 2 were inter-mixed across the sessions.

