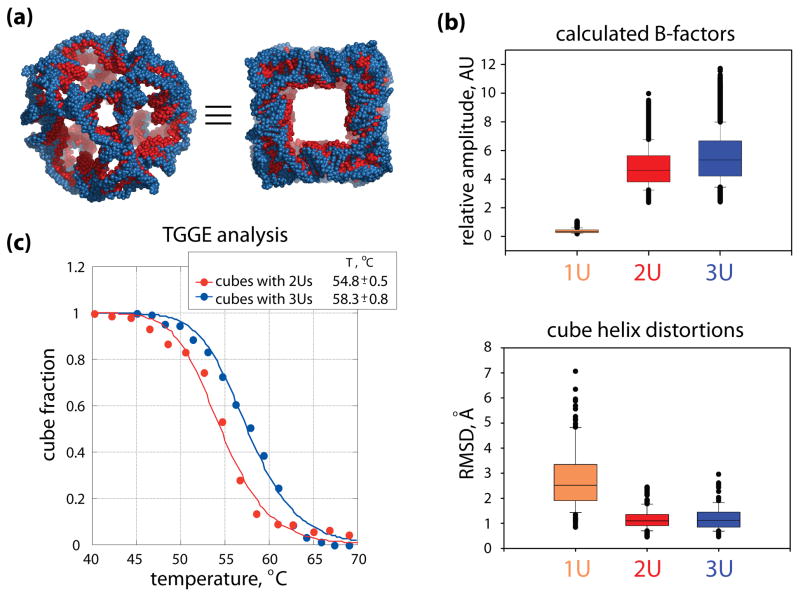
Figure 5.
Structural dynamics yields insights into melting temperature differences between the 2U and 3U cubes. (a) Two views of the maximum size (refer to the text for details) overlaid models of the 2U (red) and 3U (blue) cubes, featuring the truncated corners linked with single strands of uracils (left) and the cube faces (right). In both cubes the helical, 10 bp-long edges have the same nucleotide make-up. (b) Box plots of the calculated normalized B-factors (top) and the geometric distortions in the helices (bottom). In both plots the medians are marked as horizontal lines inside each box, and the 25th and 75th percentile values are indicated by the bottom and the top extents of the boxes. Error bars below and above each box indicate the 10th and 90th percentile values. Outliers are shown as overlapping black dots. In the top plot, the B-factors were calculated for the top 6 normal modes of motion (cumulatively) for all the atoms in each of the three cube models (in arbitrary units, marked as AU). The difference in the atomic fluctuations in the 1U cube and the 2U and 3U cubes is striking, but the smaller difference between the atomic mobility in the 2U and 3U cubes is also statistically significant. The median values for the 1U, 2U and 3U cubes are, respectively, 0.4, 4.6, and 5.3. Pair-wise comparisons of the data sets show statistically significant differences with the p-value P =< 0.001 in Mann-Whitney tests. The lower box plots capture geometric distortions measured for the helices of the three cube models subjected to normal mode motions. Helices in the 2U and 3U cubes experience minimal distortions while the motions of the whole cubes increase with their size (top b panel). RMSDs were calculated for the P atoms of the helical backbones, between the initial ANM states and the extreme distortion frames in the top 6 normal modes. The median values for the 1U, 2U and 3U cubes are 2.5Å, 1.1Å and 1.1Å, respectively. The differences between the 2U and 3U cube helix distortions are not statistically significant. Together with the energy data calculated for the cubes (refer to the text), the results shown in (b) suggest that corner linkers contribute to the melting temperature differences measured for the 2U and 3U cubes. (c) Melting curves obtained from thermal gradient gel electrophoresis (TGGE) analysis for the nanocubes with two and three corner uracils (2Us and 3Us respectively). From the TGGE experiments (Supporting Information, Figure S1), Tm for 3Us cubes was determined to be higher by ~ 3.5°C than for the cubes with 2Us. These results are in a good agreement with UV melting experiments (data not shown).

