Fig. 4.
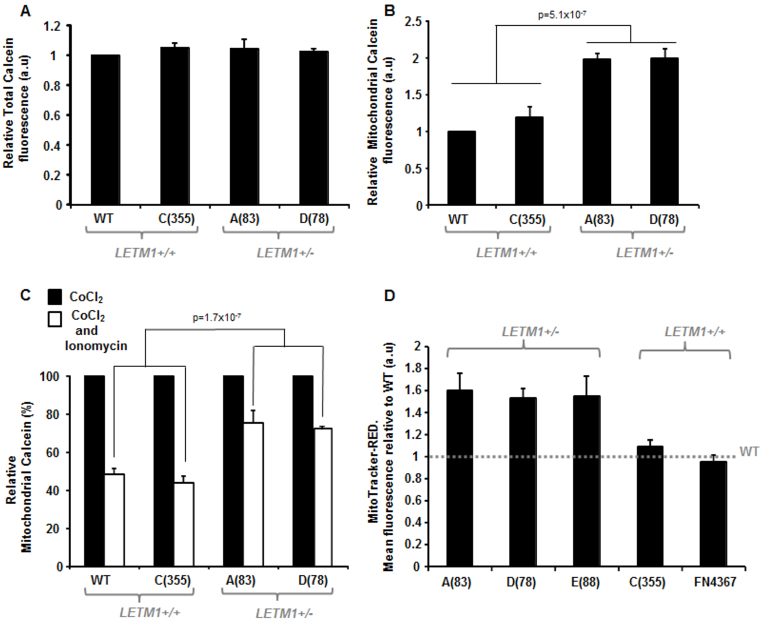
Mitochondrial transition pore (mPTP) dyamics and mitochondrial membrane polarization in WHS-patient LCLs. (A) Total cellular Calcein fluorescence is comparable between WT LCLs and WHS patient and WHS-like patient LCLs irrespective of LETM1 copy number. Calcein fluorescence was measured in the absence of CoCl2 and expressed as fold change relative to WT LCLs (a.u., arbitrary units). Data represents the mean ± s.d. from three separate experiments (FITC-A: area under the curve). (B) Mitochondrial calcein fluorescence levels (a.u., arbitrary units) indicate that the WHS LCLs A (83) and D(78) both exhibit elevated levels of mitochondrial calcein retention compared with WT LCLs and those of patient C(355). Here, calcein fluorescence is measured in the presence of CoCl2, which quenches the cytoplasmic (i.e. non-mitochondrially derived) signal. Data represent the mean ± s.d. from three separate experiments (FITC-A: area under the curve). (C) Mean relative level of mitochondrial calcein retention in WHS LCLs of differing LETM1 copy number compared with WT LCLs in the absence (black bar) or presence (white bar) of the Ca2+ ionophore, ionomycin. Both WT and C (355) exhibit a near 60% drop in calcein retention following ionomycin (500 nM) relative to CoCl2 treatment alone. This is in contrast to A(83) and D(78) LCLs, which only drop by about 20–30% under these conditions. This is suggestive of an insensitive mPTP favouring a closed conformation conducive to mitochondrial calcein retention. Data represents the mean ± s.d. from at least three separate experiments (FITC-A: area under the curve). (D) Mean relative fluorescence of MitoTracker-Red in WHS LCLs is shown relative to that of wild-type (WT) normal LCLs, the latter illustrated by the horizontal dashed line. Cells were treated with 250 nM MitoTracker-Red for 15 minutes and fluorescence quantified using the FACS Canto platform. WHS LCLs A(83), D(78) and E(88) exhibit elevated MitoTracker-Red fluorescence, suggestive of hyperpolarised resting mitochondria (elevated ΔΨmito), compared with WT LCLs and those from patients C(355) and FN4367 (P<0.05, Student’s t-test). Data represent the mean ± s.d. from three separate experiments (PE-A: area under the curve). Control experiments, using depolarising and hyperpolarising treatments, are shown in supplementary material Fig. S1A,B.

