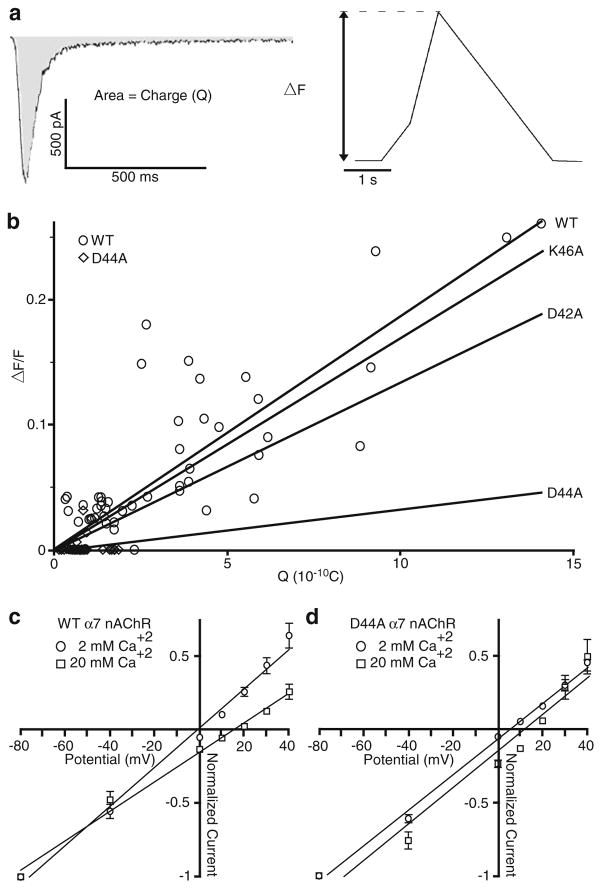
Fig. 2.
Mutations to the ECD of α7 nAChR reduce calcium permeability. Hippocampal neurons coexpressing Ric3, GCaMP3, and either WT or mutated α7 nAChR were subjected to a 2-s application of 1 mM ACh and assessed for both their electrophysiological and fluorescence responses. Changes in intracellular calcium concentration were assessed using fluorescence imaging and GCaMP3. a The level of intracellular free calcium (expressed as the ratio of peak fluorescence over the basal fluorescence (ΔF/F)) is proportional to the integrated membrane current (charge, Q), which is estimated as the area under the current trace. b The plot of the intracellular free calcium and the integrated current yields a near linear relationship (shown is WT and D44A actual data; and the linear regression for WT (n =56; Rval=0.4759), D42A (n =34; Rval= 0.05222), D44A (n =31; Rval=0.006528), and K46A (n =33; Rval= 0.2147)). c, d The reversal potential (Vrev) was measured using external solutions containing 2 and 20 mM Ca2+ for WT and D44A mutant, using a 4-s pre-application of 10 μM PNU-120596 and a 2-s application of 1 mM ACh. c The current–voltage relationship of WT α7 nAChR showed an Vrev of −1.1 (n =6; Rval=0.9901) and 15 mV (n =8; Rval= 0.9915) at 2 and 20 mM Ca2+, respectively. d The current–voltage relationship of the D44A mutant α7 nAChR showed an Vrev of 5.6 (n = 8; R val=0.9959) and 12.2 mV (n = 7; Rval=0.9547) at 2 and 20 mM Ca2+, respectively. To calculate the Vrev, peak currents were normalized to the response at −80 mV and fitted using a linear regression with Graph Pad Prism 5. All data are plotted as mean±SEM

