FIGURE 5.
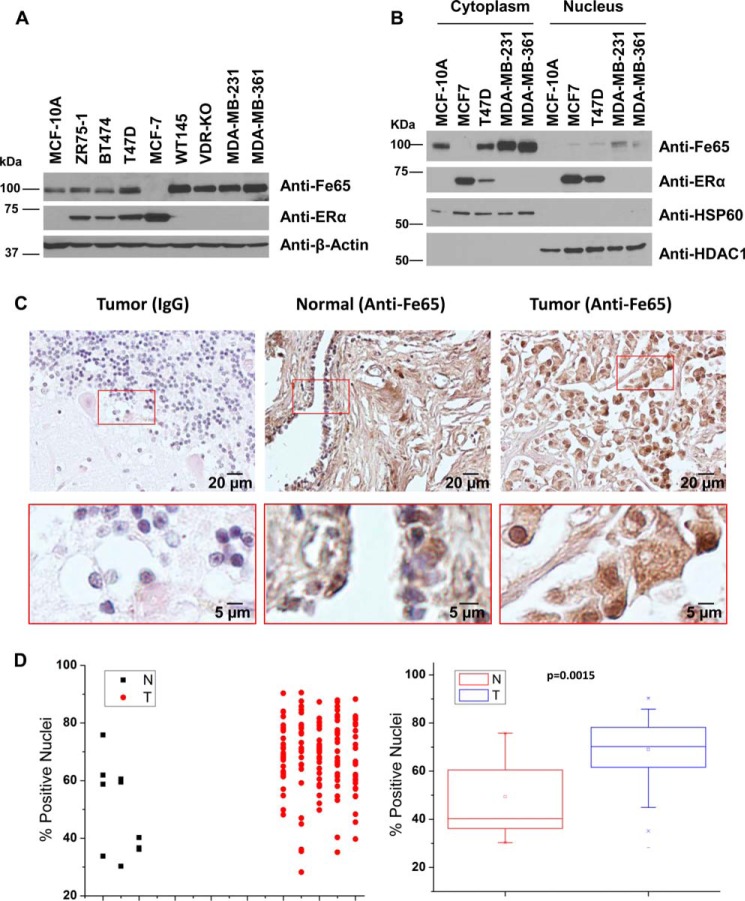
Fe65 is expressed in breast epithelial cells, and the expression is increased in BCa cells and breast tumor tissue samples. A, whole cell lysates of non-tumorigenic breast epithelial (MCF-10A) and BCa cells were subjected to IB analyses with the indicated antibodies. β-actin blot was included to show even loading. B, cytoplasmic and nuclear extracts were subjected to IB analyses with indicated antibodies. Hsp60 and HDAC1 blots were included to show the separation of cytoplasmic and nuclear extracts. C, representative images of normal breast and tumor tissue sections that were immunohistochemically stained with control IgG or anti-Fe65 as indicated. Pictures in the lower panels are enlarged (4×) versions of the marked areas of those in the top panels to show the bluish nuclei of normal ductal epithelial cells (middle panel), which indicated weak Fe65 signals, and the strong nuclear staining of breast tumor cells (right panels). D, Fe65 expression was assessed by IHC staining and automated quantification of TMA slides containing 140 cores of breast ductal carcinomas (T) and 10 cores of normal and adjacent breast tissues (N). The dot plot shows the distribution of nuclear Fe65 signals, whereas the tube plot compares the range and average nuclear Fe65 levels between N and T groups.

