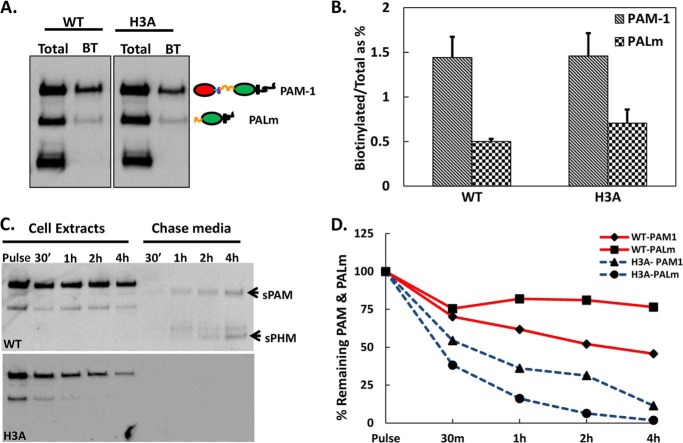
FIGURE 5.
Internalized PAM-1/H3A is degraded. A, cells chilled to 4 °C were exposed to cell-impermeant activated biotin for 10 min; the reaction was quenched and biotinylated proteins isolated from cell lysates were fractionated and probed for PAM using affinity purified exon 16 antibody. The total lanes represent 0.5% of the amount analyzed after biotinylation (BT). B, graph shows the ratio of biotinylated intact PAM-1 and membrane PAL to total PAM-1 or membrane PAL at steady state in both cell types, using lighter exposures in the linear range for quantification. C, cells kept at 37 °C were exposed to cell impermeant-activated biotin for 10 min; the reaction was quenched and cells were harvested or chased in growth medium for the indicated amount of time; biotinylated proteins were isolated from cell extracts and spent media, fractionated, and probed for PAM using the exon 16 antibody. Arrows indicate secreted products produced from biotinylated PAM-1. D, biotinylated PAM-1 and membrane PAL remaining at each chase was plotted as a percentage of the total present after the pulse. B and D are averages of two experiments.

