FIGURE 8.
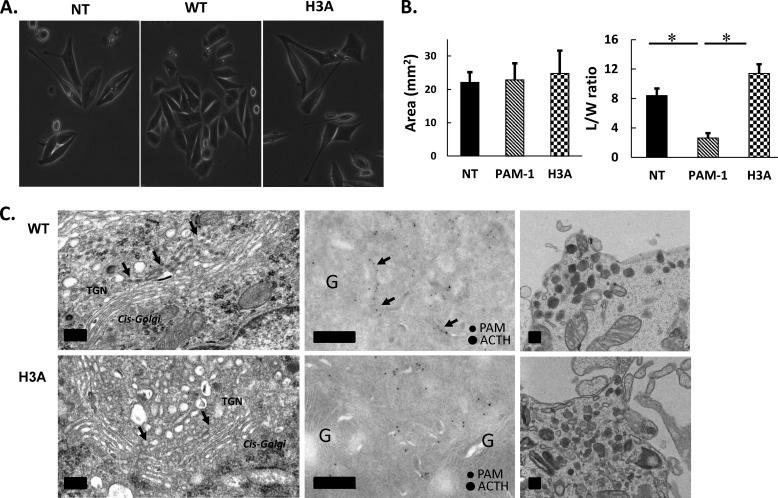
Morphology of AtT-20 cells expressing PAM-1/H3A. A, phase image of non-transfected (NT), WT PAM-1, and PAM-1/H3A expressing AtT-20 cells shows altered cell morphology. B, cell area and length/width ratio were quantified, demonstrating that PAM-1/H3A cells were more similar to non-transfected AtT-20 cells than to PAM-1 AtT-20 cells (*, p < 0.05, n = 5). C, transmission EM shows condensation of protein in the cisternae of the TGN in WT PAM-1 cells; this phenomenon was not observed in PAM-1/H3A cells (left). Immunolabeling of cryosections shows PAM and ACTH in a trans-most cisterna of the TGN in a PAM-1 cell (arrows); PAM staining in the tubulovesicular structures of the TGN was similar in WT PAM-1 and PAM-1/H3A cells (middle). Mature secretory granules at the tips of the cells were similar in both lines (right). Scale bar = 200 nm.

