FIGURE 9.
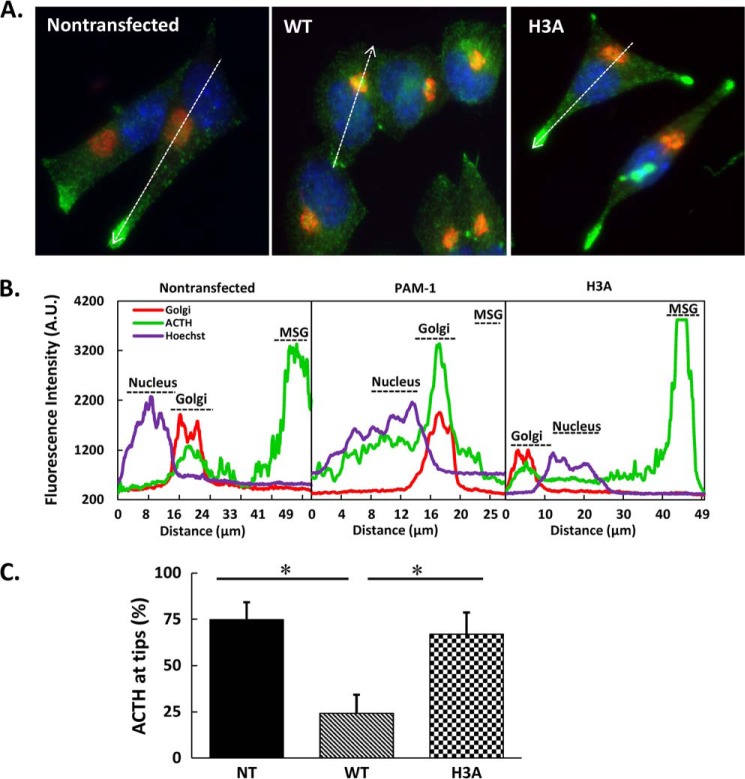
ACTH localization in PAM-1/H3A AtT-20 cells. A, steady state distribution of ACTH was compared with that of a cis-Golgi marker (GM130) in non-transfected (NT), WT PAM-1 and PAM-1/H3A AtT-20 cells. As observed previously, ACTH accumulated in the Golgi region in PAM-1 AtT-20 cells and at the tips of processes in non-transfected cells (arrows). In PAM-1/H3A AtT-20 cells, ACTH accumulated at the tips of cellular processes (arrows). B, line scan through the long axis of each cell allowed quantification of differences in steady state localization of ACTH in these three cell types. C, for each cell type, line scans (n = 10) were used to calculate the % ACTH signal accumulated at the tips of cellular processes (*, p < 0.01).

