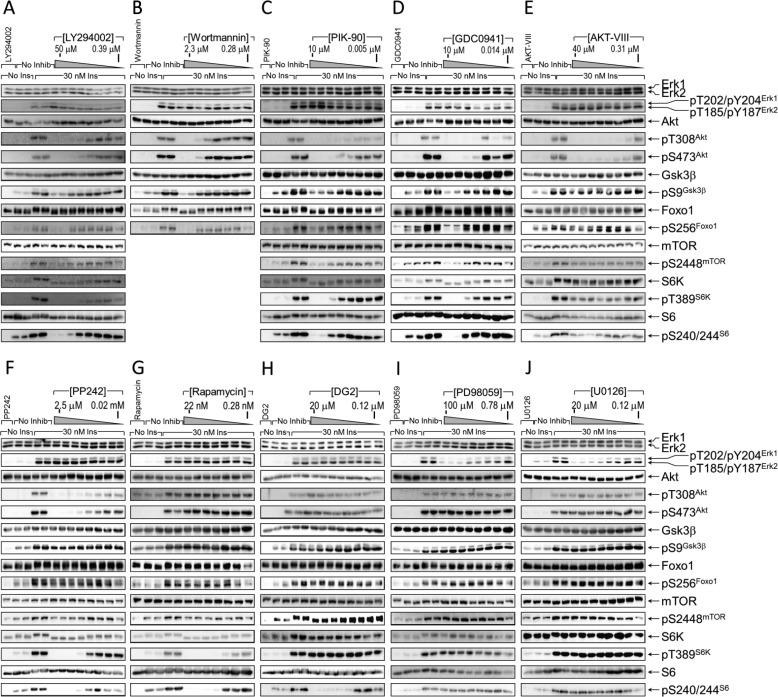
FIGURE 3.
Inhibition of insulin-stimulated Ser/Thr kinase pathways. A–J, CHOIR/Irs1 cells were treated for 30 min without or with the indicated kinase inhibitor at concentrations increasing sequentially 2-fold between the boundaries shown on each figure. Then the cells were treated with insulin (30 min, 30 nm), and the cleared lysates were immunoblotted with the indicated antibodies. The bands were quantified on a Kodak Image Station 4000MM Pro, and the data were analyzed using Carestream Molecular Imaging software version 5.0. No Inhib, no inhibition; No Ins, no insulin; Ins, insulin.

