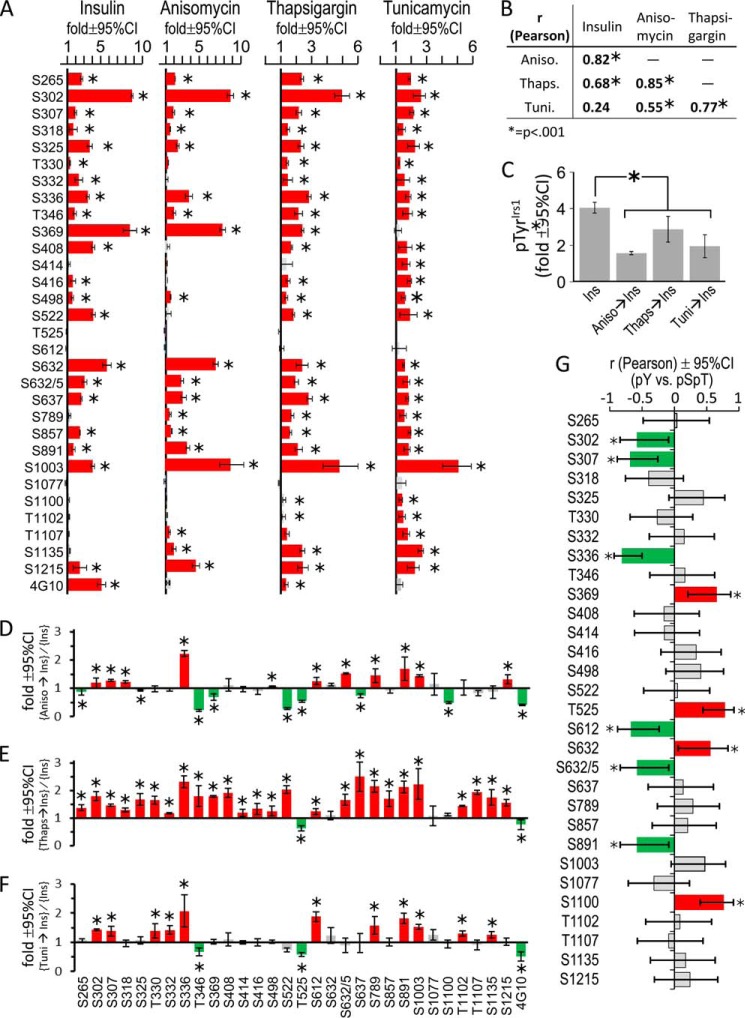
FIGURE 8.
The effect of metabolic stress upon basal and insulin-stimulated Irs1 phosphorylation. A, CHOIR/Irs1 cells were treated with insulin (30 nm, 30 min), anisomycin (5 μg/ml, 60 min), thapsigargin (300 nm, 3 h), or tunicamycin (10 μg/ml, 60 min). Irs1 Ser(P)/Thr(P) residues stimulated by insulin or agonists of metabolic stress (blots in Fig. 7B) were quantified and normalized to the phosphorylation in untreated CHOIR/Irs1 cells to determine the fold stimulation (± 95% confidence interval) above basal. Red bars indicate significant stimulation (*, p < 0.05); gray bars are not significant. B, Pearson correlation (r) of insulin- and metabolic stress-induced Irs1 Ser(P)/Thr(P) patterns shown in A. C, fold (versus basal) Tyr(P)Irs1 stimulated by insulin alone (30 nm, 30 min) or by insulin preceded by anisomycin (5 μg/ml, 60 min), thapsigargin (300 nm, 3 h), or tunicamycin (10 μg/ml, 60 min) treatment. D–F, the Irs1 Ser(P)/Thr(P) residues stimulated by insulin alone or insulin preceded by metabolic stress (blots in Fig. 7C) were quantified, normalized to the basal phosphorylation in untreated cells, and expressed as the ratio (metabolic stress plus insulin)/(insulin alone) (fold ± 95% confidence interval). Red bars indicate significantly greater Ser/Thr phosphorylation in cells pretreated with the indicated agent, and green bars significantly less (*, p < 0.05). G, Pearson correlation (r ± 95% confidence interval) of Irs1 Ser(P)/Thr(P) residues in cells treated with insulin, or with anisomycin, thapsigargin, or tunicamycin followed by insulin, with the fold insulin-stimulated Tyr(P)Irs1 observed under these conditions; green bars indicate Ser(P)/Thr(P) residues that correlate significantly with less Tyr(P)Irs1; red bars indicate Ser(P)/Thr(P) residues that correlate significantly with more Tyr(P)Irs1 (*, p < 0.05); gray bars are not significant. Ins, insulin; Aniso, anisomycin; Thaps, thapsigargin; Tuni, tunicamycin; CI, confidence interval.

