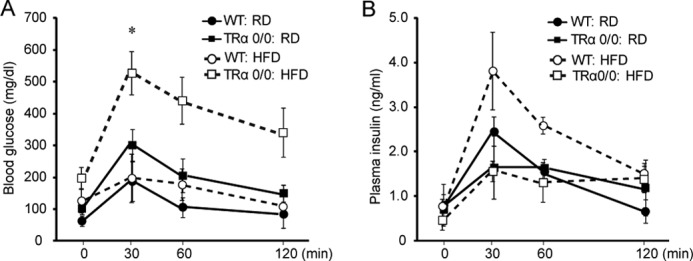
FIGURE 5.

Intraperitoneal glucose tolerance test in WT or TRα 0/0 mice. Glucose tolerance test is shown in WT and TRα 0/0 mice after 30 weeks of RD or HFD feeding. Each group of mice (n = 6) was injected with glucose, and blood glucose (A) and plasma insulin (B) levels were measured after 0, 30, 60, and 120 min. Bars represent the mean ± S.D. (n = 6). *, p < 0.05.
