
FIGURE 3.
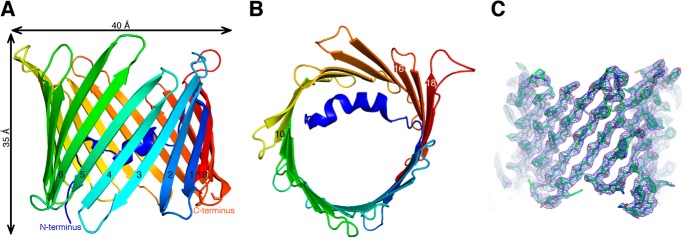
Overall structure of zfVDAC2. Shown are cartoon representations of zfVDAC2 viewed perpendicular to the membrane plane (A) and in the membrane plane (B). The protein backbone is rainbow-colored from the N terminus (blue) to the C terminus (red). A 2Fo − Fc map contoured at 1.5σ is displayed in a blue wire frame with the zfVDAC2 model shown in sticks (C).