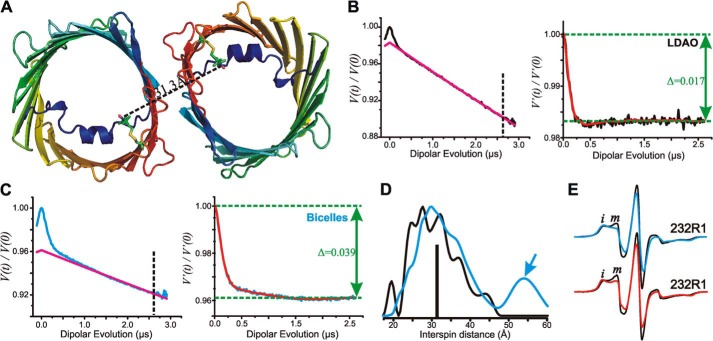
FIGURE 7.
Interspin distance measurements of zfVDAC2 232R1. A, cartoon representation of zfVDAC2 232R1 showing the expected distance based on modeling of R1 on the zfVDAC2 structure. Models of the R1 side chain at site 232 are shown as stick representations. The black dashed line shows the expected interspin distance in the crystallographic dimer. B, left, raw data (black) and exponentially decaying background signal (magenta) arising from random intermolecular distances in LDAO. For analysis, the raw data were truncated beyond 2.6 μs (vertical dashed line) to suppress the artifact caused by pulse overlap. Right, background-corrected DEF of zfVDAC2 232R1 reconstituted in LDAO. The fit of the DEF is shown in red. Δ, “depth of modulation” see “Experimental Procedures.” C, left, raw data (cyan) and exponentially decaying background signal (magenta) of DEER data in bicelles. The raw data were truncated beyond 2.6 μs (vertical dashed line) to suppress artifact. Right, background-corrected DEF of zfVDAC2 232R1 reconstituted in bicelles. D, distance distributions of zfVDAC2 232R1 reconstituted in LDAO and bicelles are shown in black and cyan, respectively. The vertical black bar indicates the expected distance from modeling the R1 side chain at site 232 shown in A. E, top spectra, EPR signals of 232R1 in LDAO (black) and bicelles (cyan). Bottom spectra, EPR spectra of osmolyte perturbations for residue 232R1 in LDAO recorded in buffer (black) and in buffer containing 30% sucrose (red). Spectral intensities corresponding to relatively immobile (i) and mobile states (m) of R1 are indicated.

