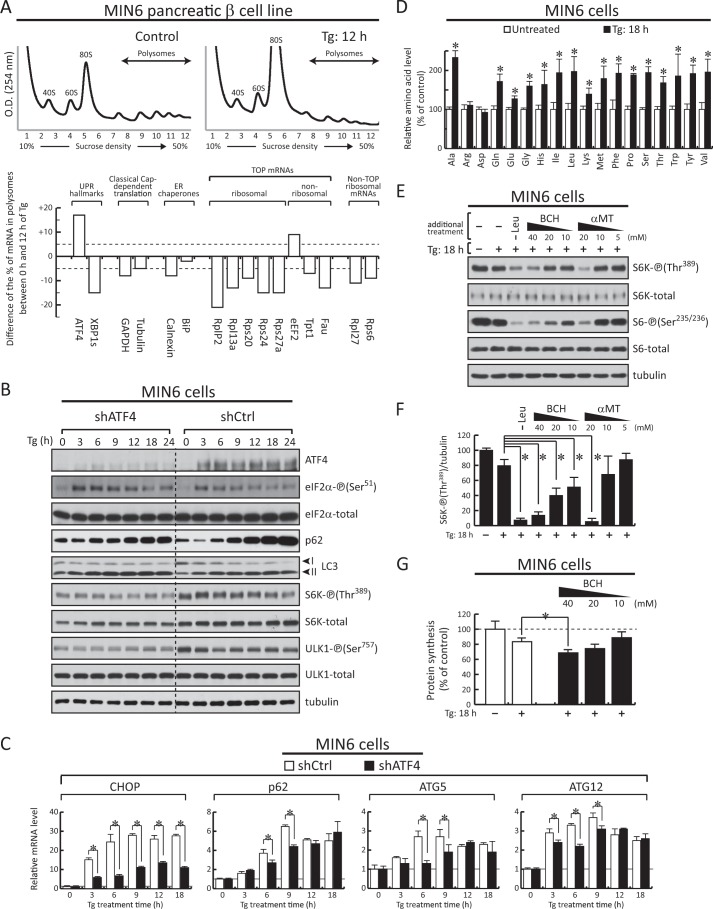
FIGURE 6.
Cross-talk between amino acid uptake and mTORC1 signaling during prolonged ER stress in mouse pancreatic β cells. A, polysome profiles (upper panel) and summarized distributions of mRNAs in polysomes (lower panel) of selected mRNAs in MIN6 cells either untreated or treated with Tg (400 nm) for 12 h as described in Figs. 2 and 3, respectively. B and C, Western blot analysis of extracts (B) and RT-qPCR analysis of RNAs (C) isolated from MIN6 cells treated with Tg for the indicated times following 3 days of infection with adenovirus expressing either control shRNA or shRNA against ATF4. RT-qPCR data were normalized to GAPDH levels and expressed as a ratio to the value of untreated samples. D, intracellular amino acid levels in MIN6 cells either untreated or treated with Tg for 18 h. Results are the mean of triplicate determinations. E, Western blot analysis of extracts from MIN6 cells either untreated or treated with Tg for 18 h alone or with depletion of Leu (−Leu) or increasing concentrations of inhibitors of system L (2-aminobicyclo-(2,2,1)-heptane-2-carboxylic acid (BCH) and α-methyl-dl-tryptophan (αMT)). F, quantitation of the intensities of phosphorylated S6K as depicted in E was calculated based on the densitometry analysis of triplicate determinations using NIH ImageJ software. G, [35S]Met/Cys incorporation into proteins in MIN6 cells either untreated or treated with Tg for 18 h alone or in the presence of increasing concentrations of system L inhibitor 2-aminobicyclo-(2,2,1)-heptane-2-carboxylic acid (BCH). Results are the mean of triplicate determinations. The asterisks indicate p < 0.05. Error bars represent S.E.

