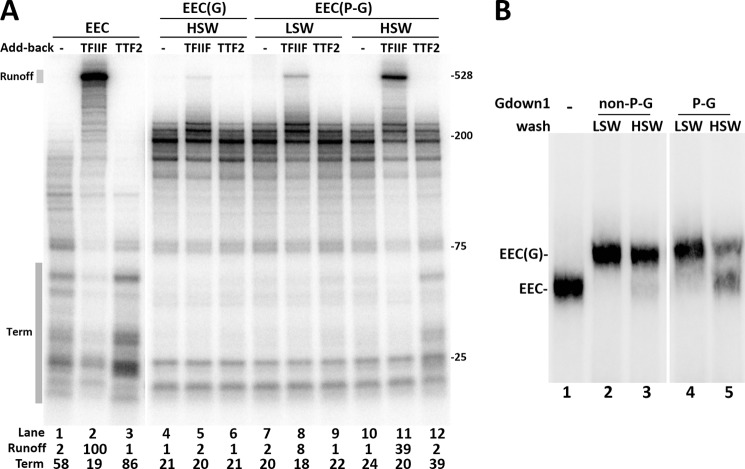
FIGURE 5.
Phosphorylated Gdown1 has reduced affinity for Pol II. A, Gdown1 or phosphorylated Gdown1 (P-G) was incubated with EECs and then washed by LSW or HSW as indicated. TFIIF or TTF2 were added back as indicated before a 6-min chase. Intensity of the runoff region in each lane was quantified and normalized against the TFIIF only lane. The termination region (Term) in each lane was quantified and is shown as its percentage of the total lane intensity. B, EC-EMSA. Isolated EECs were incubated with 1 pmol of the nonphosphorylated Gdown1 (non-P-G) or Ser-270-phosphorylated Gdown1 (P-G) before being washed with 60 mm KCl (LSW) or 1.6 m KCl (HSW) as indicated. The complexes were digested off the beads by SacI at 37 °C for 15 min and run on a 4% native acrylamide gel for 2.5 h at 6 W before phosphorimaging.

