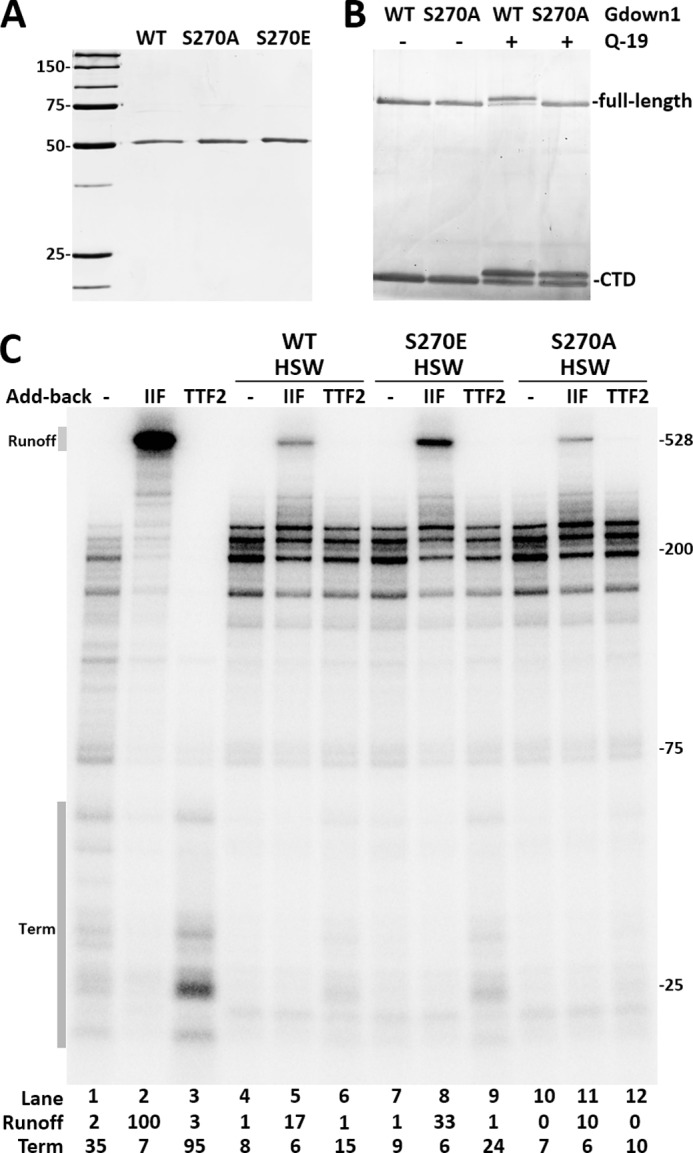
FIGURE 6.

Identification and confirmation of the site of phosphorylation. A, purified wild-type (WT) and mutant Gdown1 proteins were analyzed by SDS-PAGE and silver staining. B, wild-type and mutant full-length Gdown1 proteins were mixed with the wild-type Gdown1-CTD protein and subjected to mock kinase reactions (−) or reactions containing Mono Q fraction 19 (+). C, wild-type or mutant Gdown1 proteins were incubated with EECs and then washed with high salt (HSW). TFIIF or TTF2 were added back as indicated before a 7-min chase. Intensity of the runoff region in each lane was quantified and normalized against lane 2. The termination region (Term) in each lane was quantified and is shown as its percentage of the total lane intensity.
