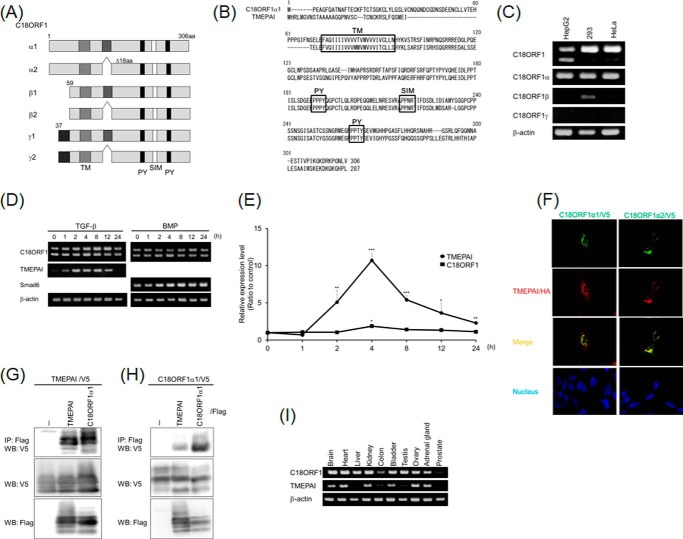
FIGURE 1.
Comparison between C18ORF1 and TMEPAI. A, alternative splicing forms of C18ORF1. C18ORF1 has six isoforms. TM, transmembrane domain; PY, PY motif; SIM, Smad-interacting motif. B, alignment of amino acid sequences between C18ORF1α1 and TMEPAI. C, expression of C18ORF1 isoforms detected by RT-PCR. Total RNAs from HepG2, 293, and HeLa cells were prepared and followed by cDNA synthesis and PCR. Upper panel, whole C18ORF1 expression is shown. The upper and lower bands indicate C18ORF1 with and without 18 amino acids, respectively. The 2nd, 3rd, 4th, and bottom panels show expressions of C18ORF1α, C18ORF1β, and C18ORF1γ subfamily, and β-ACTIN mRNAs, respectively. D, effect of TGF-β or BMP on C18ORF1 mRNA expression. HepG2 cells were stimulated with either 5 ng/ml TGF-β or 25 ng/ml BMP-6 for indicated times. The RT-PCR was then performed using specific primer sets. The upper and lower bands corresponding to C18ORF1 mRNA indicate C18ORF1 and C18ORF1 without 18 amino acids in its cytoplasmic region, respectively. TMEPAI and Smad6 mRNA expressions were used as positive controls for TGF-β and BMP-6 stimulation, respectively. β-Actin mRNA was used as an internal control. E, expression of C18ORF1 and TMEPAI by quantitative PCR. All values represent mean ± S.D. Significantly different from the absence of TGF-β: *, p < 0.05; **, p < 0.01; ***, p < 0.001. F, colocalization of C18ORF1 with TMEPAI. Either C18ORF1α1/V5 (left panels) or C18ORF1α2/V5 (right panels) was transfected with TMEPAI/HA into 911 cells. Twenty four hours after transfection, cells were fixed and stained with mouse anti-V5 and rat anti-HA3F10 monoclonal antibodies. The Alexa488-conjugated goat anti-mouse and the Alexa555-conjugated goat anti-rat IgG antibodies (Molecular Probes) were used for visualization. Colocalization in the merge panel can be seen in yellow. Nuclear staining (blue) was carried out using DAPI. G, TMEPAI makes homomeric interaction as well as heteromeric interaction with C18ORF1α1. The cell lysates were immunoprecipitated (IP) with anti-FLAG M2 antibody and then analyzed by Western blot (WB) with anti-V5 antibody (upper panels). The middle and lower panels indicate total expressions of TMEPAI/V5 and C18ORF1α1/FLAG or TMEPAI/FLAG, respectively. H, homomeric and heteromeric complex between C18ORF1α1 and TMEPAI. The experiments were carried out according to the description above. Upper panel, heteromeric complex between C18ORF1α1 and TMEPAI or homomeric complex of C18ORF1α1. Middle panel, expression of C18ORF1α1/V5. Lower panel, expression of TMEPAI/FLAG and C18ORF1α1/FLAG. I, profile of C18orf1 mRNA expression in mouse tissues. Upper panel, expression of mouse C18orf1 mRNA (middle panel) expression of mouse Tmepai mRNA (lower panel) expression of mouse β-actin mRNA.

