
FIGURE 7.
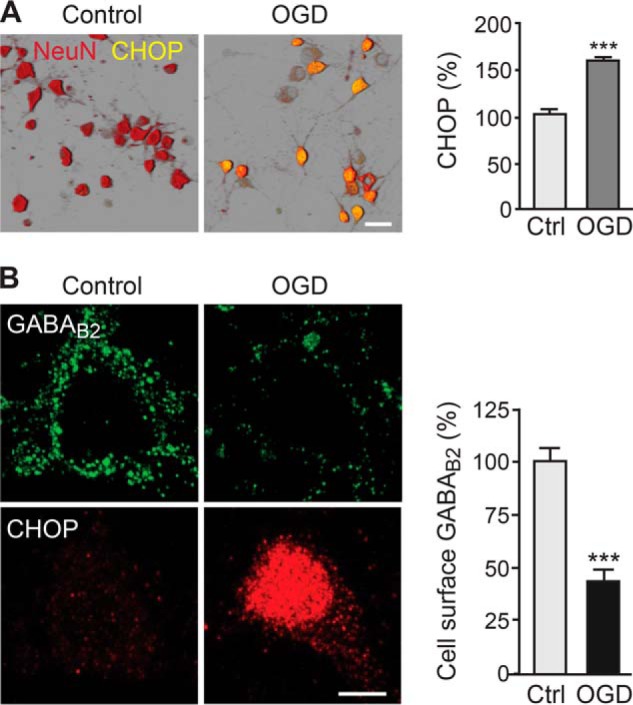
CHOP is up-regulated and GABAB receptors are down-regulated in the OGD model of cerebral ischemia. A, OGD in neurons up-regulates CHOP. Neurons were subjected to OGD for 10 min, followed by a recovery period of 24 h. Subsequently, neurons were stained for CHOP (green) and for NeuN to visualize the neurons (red). CHOP expression in neurons is depicted in yellow. Cultures not subjected to OGD served as controls (Ctrl). Left panel, representative images. Scale bar = 30 μm. Right panel, quantification of CHOP expression in neurons. Data are means ± S.E., 271 (control) and 311 (thapsigargin) neurons from three experiments. ***, p < 0.001; Student's t test. B, cell surface GABAB receptors are down-regulated following OGD. Neurons were subjected to OGD for 10 min, followed by a recovery period of 24 h, and were then stained for cell surface GABAB2 (green) and CHOP (red). Cultures not subjected to OGD served as controls. Left panel, representative images. Scale bar = 5 μm. Right panel, quantification of cell surface GABAB receptor expression. Data are means ± S.E., 30 (control) and 49 (thapsigargin) neurons from three experiments. ***, p < 0.001; Student's t test.