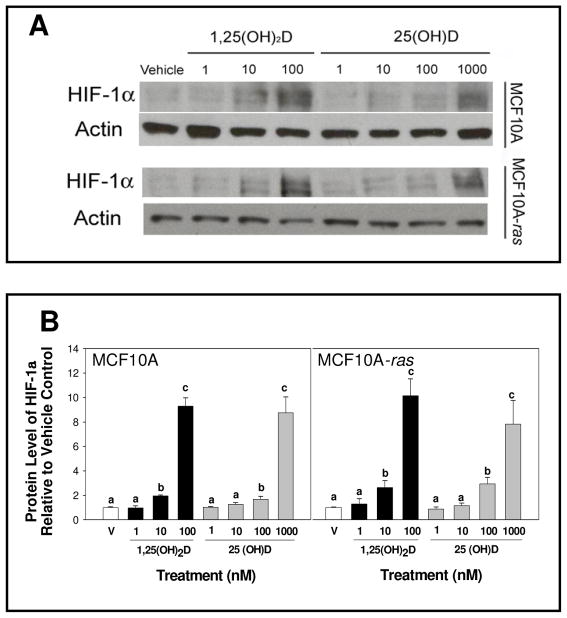
Figure 2. Does dependent induction of HIF-1α protein by 1,25(OH)2D and 25(OH) D.
MCF10A and MCF10A-ras cells were treated with either vehicle (open bars) or different doses of 1,25(OH)2D (black bars) or 25(OH) D (gray bars) for 12 h. Following harvest, lysates were used for Western blot analysis. A representative immunoblot of HIF-1α and actin protein level is shown in panel A. The quantification of the immunoblots is shown in panel B for MCF10A cells (left) and MCF10A-ras cells (right). Values are expressed as HIF-1α protein/actin protein for each sample relative to vehicle. Bars with common letter superscripts are not significantly different (p< 0.05). Data are representative of three independent experiments.

