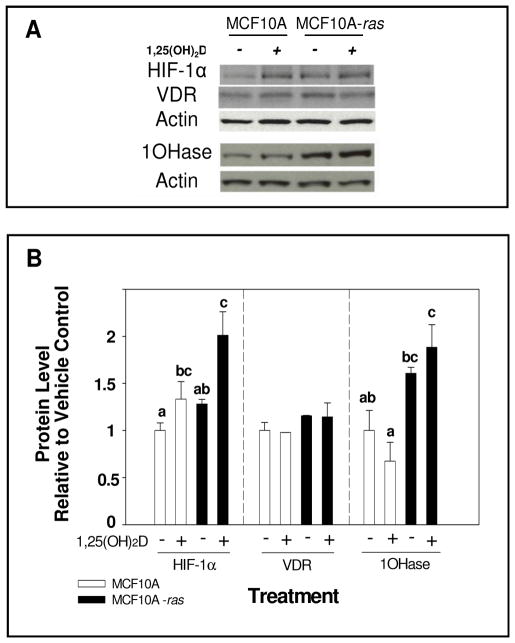
Figure 3. HIF-1α, VDR and 1α-hydroxylase protein level in MCF10A and MCF10A-ras cells.
MCF10A and MCF10A-ras cells were treated for 12 h with vehicle or 1,25(OH)2D (10 nM). A representative immunoblot of HIF-1α, VDR, 1α-hydroxylase (1OHase) and actin protein levels are shown in panel A. The quantification of the immunoblots is shown in panel B. Open bars represent MCF10A cells and black bars represent MCF10A-ras cells. Values are expressed as protein/actin protein for each sample relative to vehicle. Results are expressed as mean ± SEM. (n ≥ 5). Bars with common letter superscripts are not significantly different (p< 0.05). Data are representative of three independent experiments.

