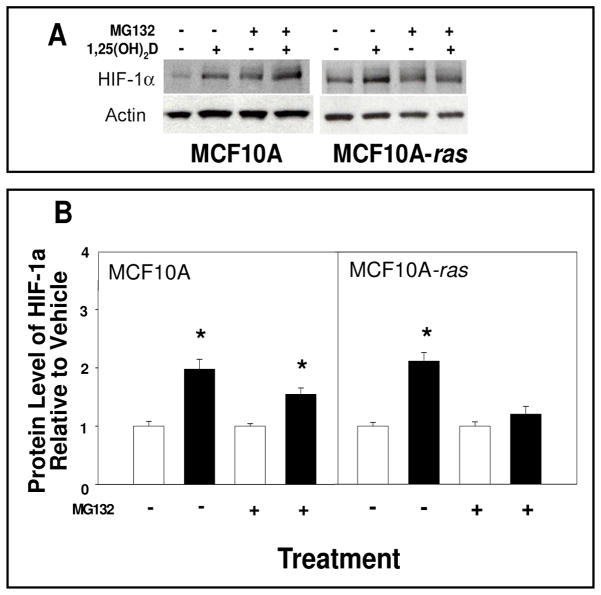
Figure 5. Effects of inhibition of protein degradation on 1,25(OH)2D-induced HIF-1α protein level in MCF10A and MCF10A-ras cells.
MCF10A and MCF10A-ras cells were treated with either vehicle or 1,25(OH)2D (10 nM) with or without MG132 (1 mM) for 12 h. A representative immunoblot of HIF-1α and actin protein level is shown in panel A. The quantification of the immunoblots is shown in panel B indicated with vehicle (open bars) and 1,25(OH)2D treatment (black bars). Values are expressed as HIF-1α protein/actin protein for each sample relative to vehicle control. Results are expressed as mean ± SEM. (n ≥ 5). Asterisk indicates significant differences between vehicle and 1,25(OH)2D treatments. (p< 0.05). Data are representative of three independent experiments.

