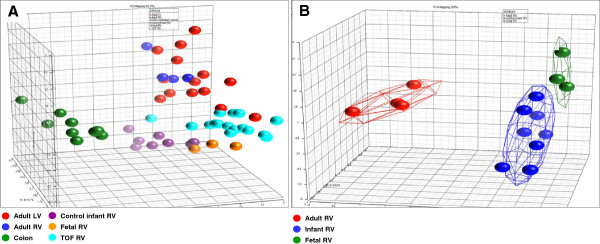
Figure 2.

Principal component analysis of the expression pattern of the GET within. (A) All groups examined. (B) Fetal, infant, and adult right ventricular tissues (all normally developing with no known defects). The colored connected lines form a cloud around the group at two standard deviations.
