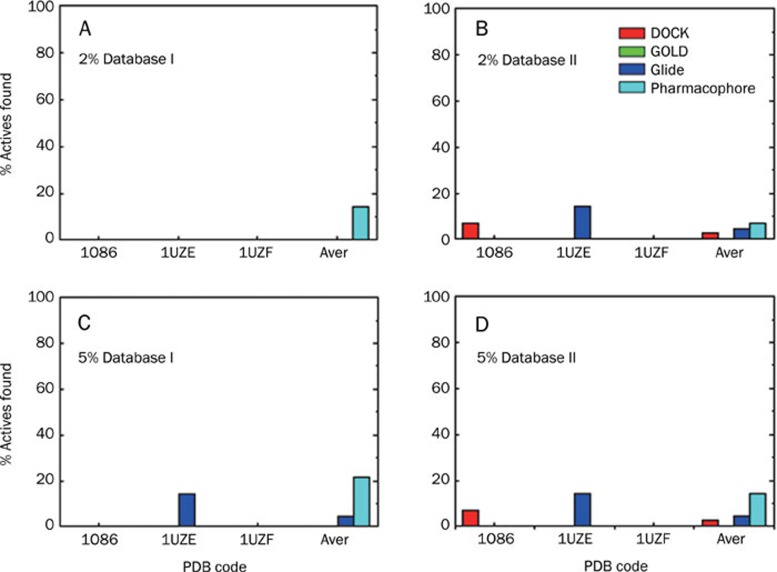
Figure 11.
Comparison of hit rates retrieved using DOCK (red), GOLD (green), and Glide (blue) at 2% and 5% of the highest ranks of the entire databases (databases I and II) with different crystal structures for the target of ACE. The last columns (Aver) represent the hit rate over the employed crystal structures for the three docking programs and the pharmacophore-based method (cyan).

