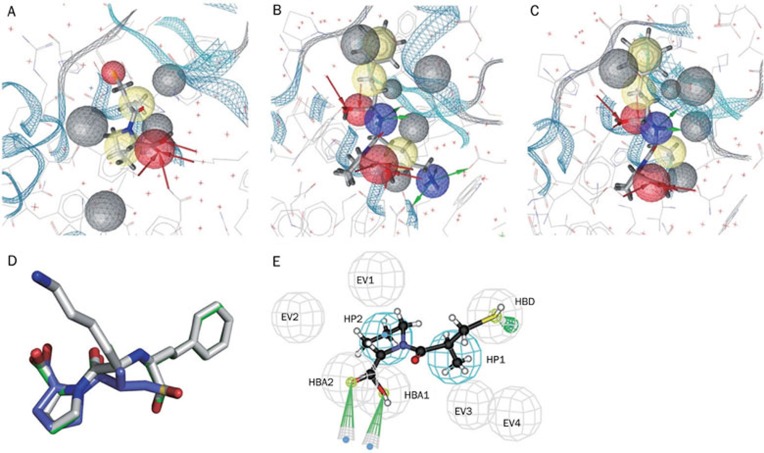
Figure 2.
Pharmacophore models of ACE derived from the X-ray crystal structures of ACE-ligand complexes (PDB entries 1UZF, 1O86, and 1UZE). (A–C) Pharmacophore models generated with LigandScout from PDB entries of 1UZF, 1O86, and 1UZE, respectively. LigandScout color codes were used to represent the pharmacophore features: hydrogen bond donor (green arrow), hydrogen bond acceptor (red arrow), hydrophobic region (yellow sphere), and excluded volume (black sphere). (D) Superposition for the three ligands bound in the crystal structures used for pharmacophore construction. (E) The refined pharmacophore model of ACE derived based on models A–C. The pharmacophore model was represented in Catalyst form: hydrogen bond acceptor (HBA), hydrogen bond donor (HBD), hydrophobic region (HP), and excluded volume (EV).

