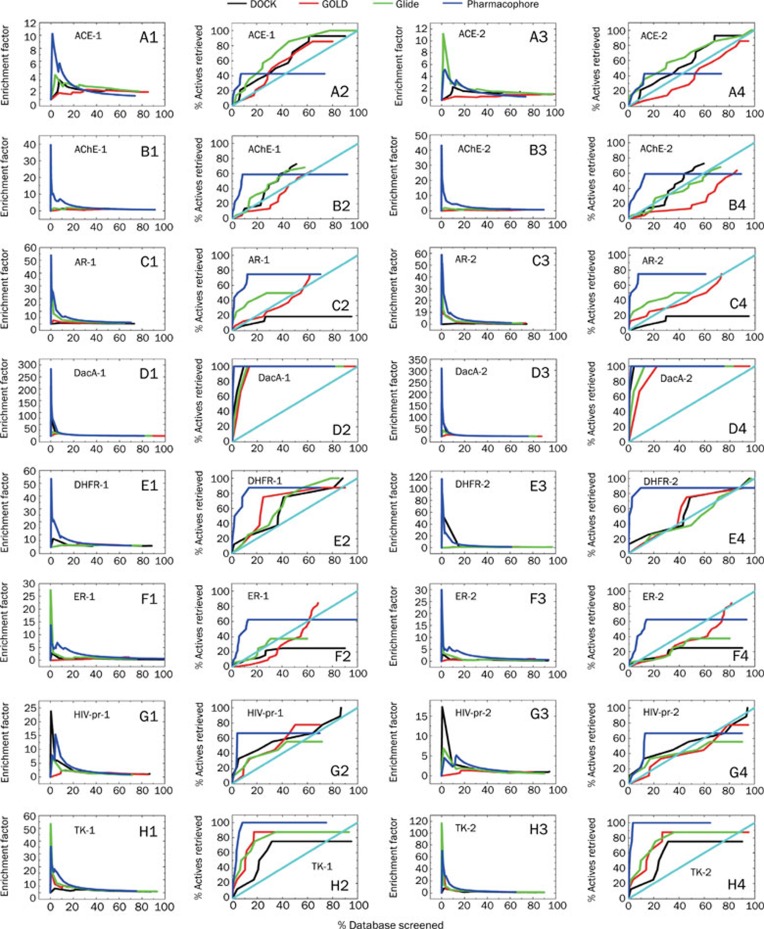
Figure 4.
Enrichment plots for the eight targets calculated for the four screening methods. (Columns 1 and 3) Enrichment factor as a function of the fraction of the ranked database. (Columns 2 and 4) The percent of known actives identified in increasingly large subsets of the ranked database. The blue, black, red and green lines, respectively, present the results of Catalyst (PBVS), DOCK, GOLD, and Glide. -1 and -2 represent the screens for databases I and II, respectively.

