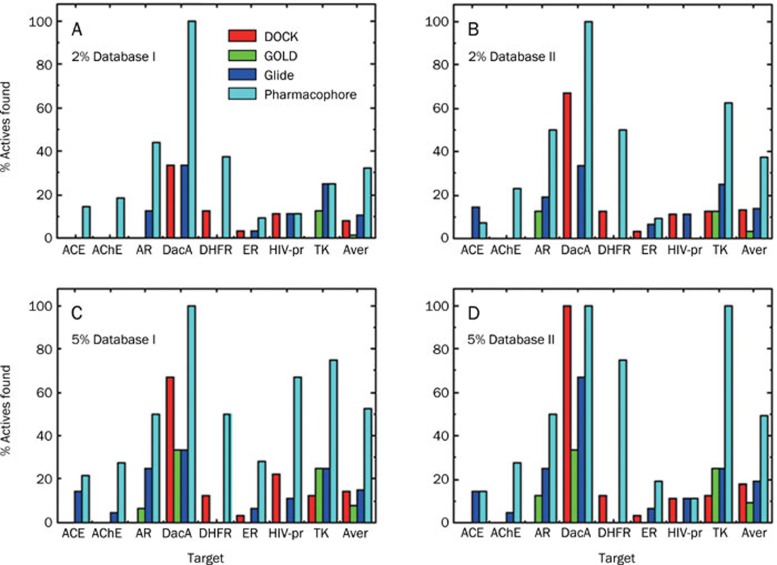
Figure 5.
Comparison of the percentage of actives (hit rates) retrieved using the pharmacophore-based method (cyan), DOCK (red), GOLD (green), and Glide (blue), at 2% and 5% of the highest ranks of the entire databases (databases I and II). The last columns (Aver) represent the averaged hit rate over the eight targets for the four screening methods.

