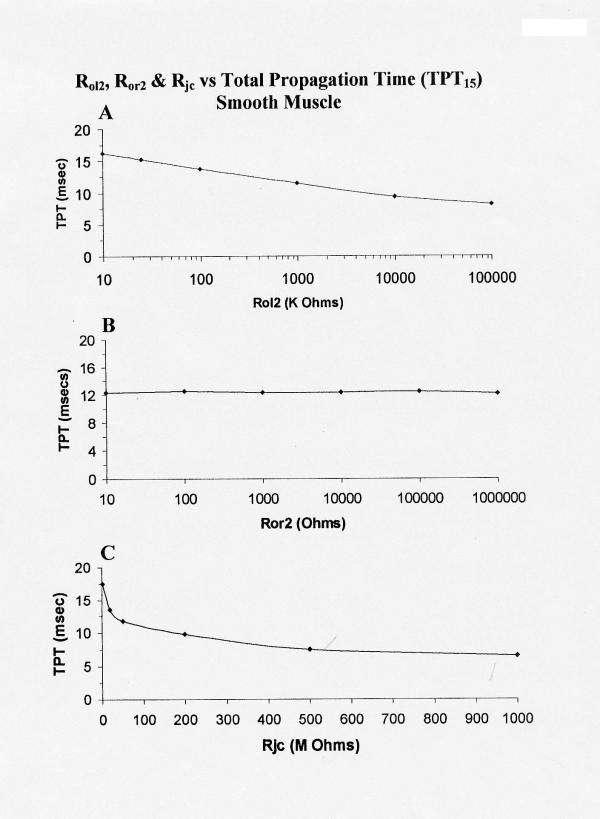
Figure 10.

Graphic summary of the effects of varying Rol2 (A), Ror2 (B), Rjc (C) on TPT over the first 15 cells of the network (5 × 5 model) of smooth muscle cells. Increasing Rol2 (A) produced a decrease in TPT. Increasing Ror2 (B) had only slight effect on TPT15 (as in cardiac muscle). Increasing Rjc (C) decreased TPT15, much like in cardiac muscle.
