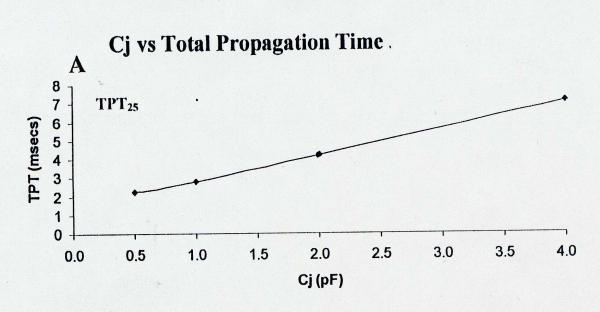
Figure 7.

Plot of total propagation time (TPT) over the entire 25-cell network as a function of the capacitance of the junctional membrane (Cj). Data were collected at more Cj values (e.g., 0.75, 8.0, and 10 pF), but these data are not plotted because all cells did not fire. Lowering Cj greatly decreased TPT25 and therefore increased velocity.
