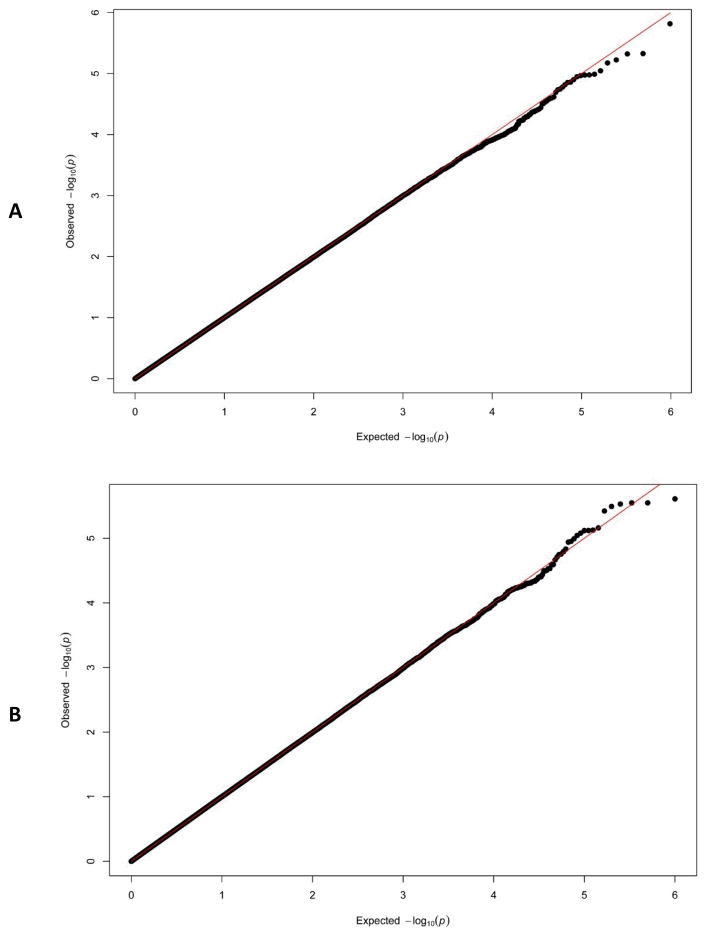
Fig. 1.
Quantile-quantile plot comparing empirical (−log10) p-values for testing the effects of a SNP set using the GEE KM test (based on 1,000,000 simulations under the null model) against those expected under the null from the first two simulation settings: A) randomly sampling scheme; B) ascertained sampling scheme. Each simulated data set has 1000 sibpairs. P-values were calculated using the perturbation based method.

