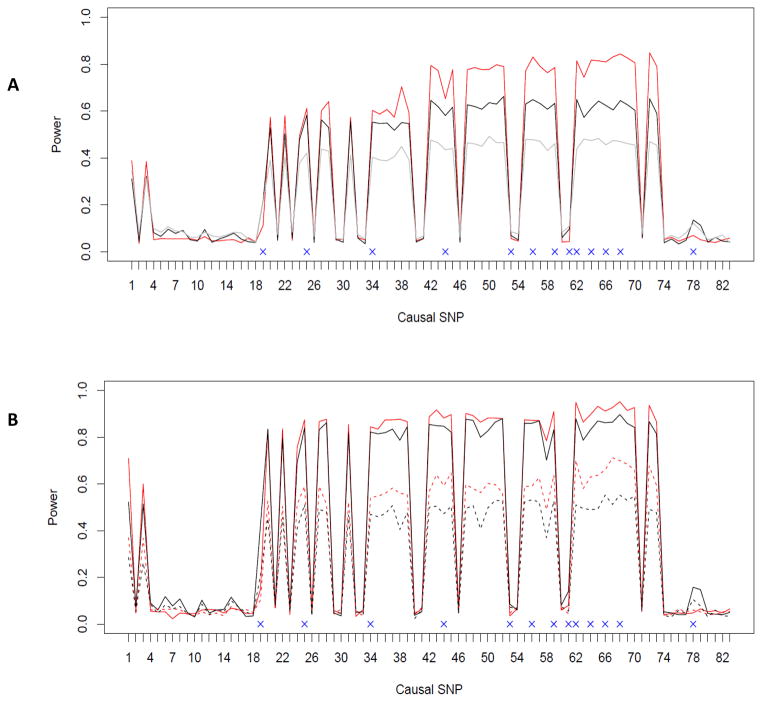
Fig. 2.
Empirical power for testing a SNP set using the ASAH1 gene: A) randomly sampling scheme; B) ascertained sampling scheme. Each of the 83 SNPs was generated as the causal variant in turn. The typed SNPs are denoted with a cross and are used in SNP set analysis. The red and black lines indicate the power curves for the proposed GEE KM test and the individual marker based minimum p-value method for testing the ASAH1 gene effects respectively when the sample size is n=2000. The gray line in Fig 2A indicates the power curves for the p degrees of freedom chi-square test (as implemented in the R package “geepack”) after removing 3 high LD SNPs. The solid and dashed lines (in Fig 2B) are observed powers for simulations with a sample size (number of sib pairs) of 2000 and 1000, respectively.

