

Abstract
Histone deacetylases (HDACs) regulate gene expression by inducing conformational changes in chromatin. Ever since the discovery of a naturally occurring HDAC inhibitor, trichostatin A (TSA) stimulated the recent development of suberoylanilide (SAHA, Zolinza®), HDAC has become an important molecular target for drug development. This has created the need to develop specific in vivo radioligands to study epigenetic regulation and HDAC engagement for drug development for diseases including cancer and psychiatric disorders. 6-([18F]Fluoroacetamido)-1-hexanoicanilide ([18F]FAHA) was recently developed as a HDAC substrate and shows moderate blood-brain barrier (BBB) permeability and specific signal (by metabolic trapping/or deacetylation) but rapid metabolism. Here, we report the radiosynthesis of two carbon-11 labeled candidate radiotracers (substrate- and inhibitor-based radioligand) for HDAC and their evaluation in non-human primate brain. PET studies showed very low brain uptake and rapid metabolism of both labeled compounds but revealed a surprising enhancement of brain penetration by F for H substitution when comparing one of these to [18F]FAHA. Further structural refinement is needed for the development of brain-penetrant, metabolically stable HDAC radiotracers and to understand the role of fluorine substitution on brain penetration.
Keywords: Carbon-11, Positron Emission Tomography, SAHA, Brain, Epigenetics, Brain permeability
Gene expression is regulated, in part, through enzyme catalyzed epigenetic modifications targeting both the DNA and its associated histone proteins.1 For example, histone acetyl transferases (HATs) catalyze the acetylation of the lysine residues of histone proteins removing the positive charge and rendering the DNA more accessible to transcription initiation complexes and RNA polymerase. In contrast, histone deacetylases (HDACs) typically catalyze the hydrolysis of the acetyl groups from lysine residues of histone proteins condensing the chromatin and repressing gene expression.2 Because the folding process induced by the deacetylation of histones represses the expression of genes which are involved in critical metabolic processes such as apoptosis, cell-cycle arrest and differentiation, HDAC has become an important molecular target in drug development.3–6
The discovery of a naturally occurring HDAC inhibitor, trichostatin A (TSA, Figure 1)7, 8, an antifungal antibiotic with anticancer activity, has stimulated the development of inhibitors of HDAC including Vorinostat (SAHA, Figure 1) which was recently approved by FDA for the treatment of cutaneous T cell lymphoma (CTCL) and other cancers.9 HDAC inhibitors are also of interest in the study and treatment of a number of CNS disorders including depression, addiction and neurodegenerative diseases.4, 10, 11 In fact, valproic acid, a class I HDAC inhibitor6, is one of the most widely used and effective antiseizure medications, which we recently showed its poor blood-brain barrier (BBB) penetration explaining the high doses needed for therapeutic efficacy.12 For this reason, the development of brain penetrant radiotracers for positron emission tomography (PET) imaging of HDAC in the brain would advance the study of this important epigenetic marker as well as the measurement of target engagement during HDAC inhibitor therapy.
Figure 1.

Structures of SAHA and trichostatin A (TSA)
Only a handful of HDAC active compounds including HDAC inhibitor drugs have been radiolabeled with either F-18 (t1/2:110 min) or C-11 (t1/2: 20.4 min) and evaluated for specificity for PET imaging (Figure 2). The first was [18F]FAHA13 which has a similar structure to SAHA except that the zinc binding hydroxamate moiety is replaced by a fluoroacetylamido group. [18F]FAHA shows good brain penetration, its deacetylation process in brain is blocked by SAHA in a dose-dependent manner14, 15 and its distribution as measured by PET parallels the HDAC IIa distribution in the primate brain as measured by immunohistochemical analysis of post-mortem tissue.15 [18F]FAHA is a HDAC substrate rather than an inhibitor and manifests very rapid metabolism to [18F]fluoroacetate which can be trapped in the brain.14 More recently, hyroxamate inhibitors, F-18 labelled SAHA derivatives ([18F]SAHA16, [18F]FESAHA17) were synthesized and evaluated in a mouse tumor model. While [18F]SAHA16 showed HDAC specific binding in tumor, both of them showed very poor BBB permeability. In another study, we radiolabeled the benzamide HDAC inhibitor, MS-27518 with carbon-11 for PET studies and reported that it showed very poor BBB penetration as a radiotracer.19 Most recently, Pike et al. labelled the β-carboline hydroxamate (KB631, Figure 2), which has high affinity for HDAC6, with carbon-11 and also observed low brain penetration.20
Figure 2.

Structures of radiolabeled HDAC inhibitors. *, C-11 or F-18.
Based on the [18F]FESAHA17 and [18F]FAHA PET studies, we set out to develop a high affinity radiotracer which also crosses the BBB freely and is metabolically stable for PET studies of brain HDAC in humans. Our preference has been to radiolabel with carbon-11 since its short half-life (20.4 min) enables the performance of serial studies in the same day wherein a subject or patients can serve as his/her own control. Herein we report the synthesis of precursors and carbon-11 radiolabeling of two different types of radiotracer candidates, an inhibitor and a substrate (Figure 3), and their PET studies in the baboon brain and an analysis of plasma clearance. We predicted that the potent TSA-like HDAC inhibitor 1 (IC50, 15 nM for HDAC1)21 would be more stable in vivo than HDAC substrate [18F]FAHA. We also predicted that HDAC substrate compound 3 would be rapidly deacetylated similar to FAHA and would have similar brain uptake and kinetics since the deacetylation of [18F]FAHA and [11C]3 by HDAC would produce [18F]fluoroacetic acid and [11C]acetic acid respectively as labelled metabolites. In addition, we attempted to label M344, which has 4 times higher potency22 than SAHA, and, although we were not successful, we describe our experience with this difficult-to-alkylate aromatic amine.23
Figure 3.

Structures of C-11 labeled trichostatin A, SAHA, and FAHA derivatives. *, C-11 or F-18.
The syntheses of the two hydroxamate reference compounds, 1 and 2, were achieved according to known procedures21, 22 and their precursors for C-11 labeling were also synthesized as shown Scheme 1. Labeling 1 with [11C]methyl iodide required a 2-step one-pot reaction, first forming the methyl ether followed by conversion to the hydroxamate. This was necessary to avoid preferential [11C]methylation of the hydroxamate moiety under basic conditions. Our initial attempt using a hydroxylamine hydrochloride and strong bases such as sodium hydroxide24 was not successful due to slow reaction rate and side product formation. However, treatment of the ester with hydroxylamine hydrochloride, using potassium cyanide as a catalyst25, 26, converted the ester to the hydroxamate within 5 minutes. Crude [11C]1 was subsequently purified by high performance liquid chromatography (HPLC). After optimization, the average decay-corrected radiochemical yield (RCY), calculated from 11CH3I, was 23±3% (decay-corrected, n=3) in a total synthesis time of 50 min. Analytical HPLC and TLC demonstrated that the radiochemical purity was >99% and the specific activity was 280±50mCi/µmol (n=3) at the time of administration to the baboon.
Scheme 1.

Synthesis of C-11 labeled HDAC radioligands.
i) phenol, aluminum chloride/ DCM, ii) NaH/DMF, [11C]methyl iodide, 5 min, 70 °C, iii) NH2OH· HCl, NaOH, KCN, MeOH/THF/water (1:1:0.4) iv) benzyl bromide, potassium carbonate/DMF, v) methyl 7-aminoheptanoate, NaH/DMF, vi) H2, Pd/C/EtOAc vii) [11C]formaldehyde, thenNaCNBH3, viii) NH2OH· HCl, NaOH, KCN, MeOH/THF/water (1:1:0.4), ix) [11C]acetyl chloride, triethylamine, THF
For [11C]2 ([11C]M344), we anticipated that N-methylation of precursor, 9, using [11C]methyl iodide/or triflate would be difficult due to inherent low nucleophilicity of the aromatic amine and the presence of a p-carbonyl group. In addition, the hydroxamate, if unprotected, would alkylate preferentially to the aromatic nitrogen in basic condition, we explored reductive amination with [11C]formaldehyde (scheme 1). We used N-methylaniline as a model compound and [11C]formaldehyde formed in situ from the reaction of trimethylamine oxide and [11C]methyl iodide27. Unfortunately the yield of [11C]dimethylaniline was unacceptably low. Nonetheless we proceeded to try these reductive alkylation conditions of 9 since reductive alkylation with in situ generated [11C]formaldehyde would have the advantage of avoiding the protection/deprotection of the hydroxamate group which would be required for alkylation with [11C]methyl iodide. More specifically, the hydroxamate is acidic (pKa= 8~9) and thus anionic under basic conditions and would be predicted to be alkylated with [11C]methyl iodide. For the reductive methylation, we used “mild” reductants such as sodium cyanoborohydride. We obtained an even poorer labelling efficiency for [11C]2 than for N-methyl aniline, which we attributed to reduced nucleophilicity of the substrate due to the presence of the p-carbonyl group.
Radiolabeling of the FAHA analogue 3 with C-11 required 2 steps, first formation of [11C]acetyl chloride using from [11C]carboxylation of methylmagnesium bromide followed by treatment with phthaloyl chloride as described previously28. Distillation of [11C]acetyl chloride into amine, 1113, in the presence of triethylamine in THF resulted in the formation of [11C]3 which was purified by HPLC. Isolated radiochemical yield and radiochemical purity were 48±7% (decay-corrected, n=5), >99% measured by radioTLC, respectively. Specific activity was 163±38 mCi/µmol (n=2) at the time of the injection.
PET studies in baboons were performed with [11C]1 and [11C]3 to determine organ uptake and clearance and regional distribution over 90 min scanning period after intravenous administration. Arterial blood plasma were also collected and counted and selected samples were analyzed using HPLC to measure the fraction of parent labeled compound at different time points during the scan. This information was used to measure the AUC for the parent labeled compounds.
As shown Figure 4 and 5, [11C]1 showed lack of brain uptake, compared with [18F]FAHA, even though measured plasma protein binding (91.5%, n=5) and lipophilicity (log D7.4= 0.5, n=5) were in the acceptable range for brain penetration29. The pattern biodistribution of [11C]1 was homogenous in various brain regions indicating a lack of specificity (Figure 6). Time-activity curves for [11C]1 in peripheral organs at baseline and after pretreatment with SAHA (1 mg/kg, 5 min before injection) showed no significant differences indicating that, similar to brain, there is no binding specificity in the major peripheral organs (Figure 7).
Figure 4.

Time–activity curves in baboon brain for [11C]1, [11C]3, [18F]FAHA (data from Reid et al., 2009). Similar data for [11C]acetate, a potential metabolite of [11C]3 is shown for comparison.
Figure 5.
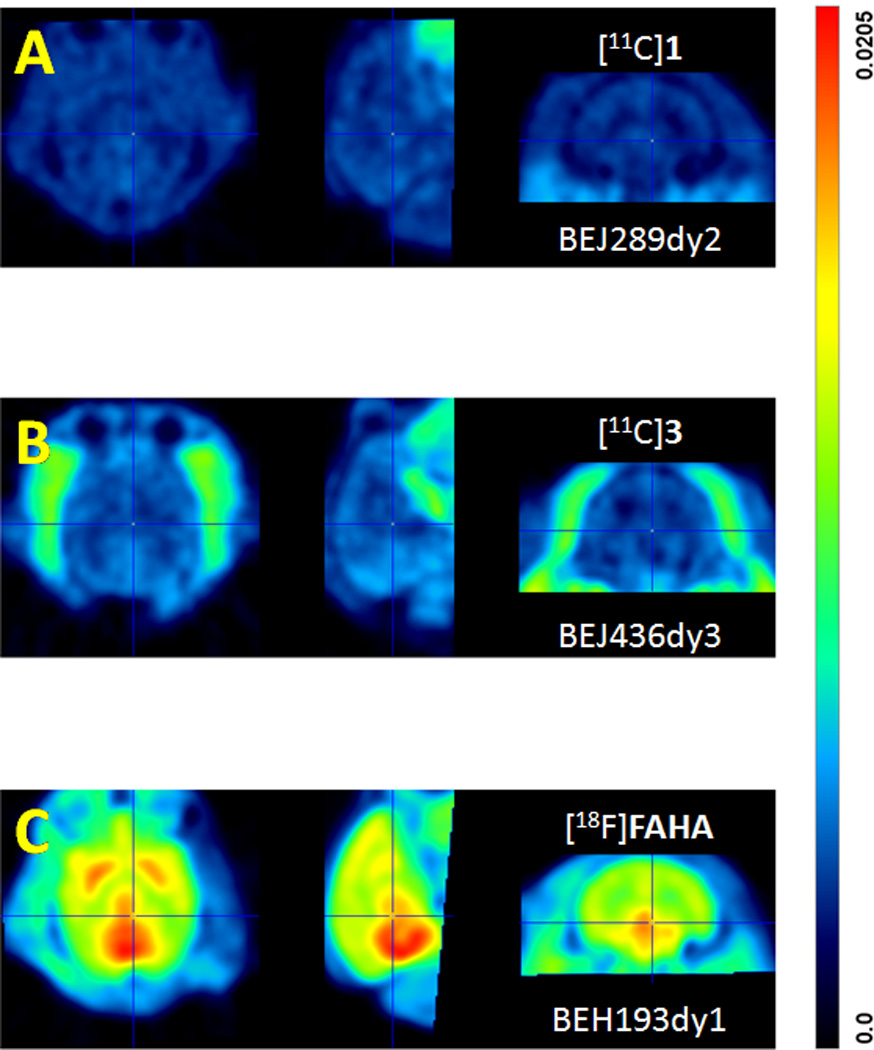
Averaged PET images for baboon brain over a 90 min scanning period for [11C]1 (panel A), [11C]3 (Panel B) and [18F]FAHA (panel C) over a 90 min scan. Each panel shows three views: transaxial (left); sagittal (middle) and; coronal (right).
Figure 6.

Time course for C-11 in different regions of the baboon brain after the administration of [11C]1; WB (whole brain); CB (cerebellum); PU (putamen); CD (caudate). %ID/cc, 100 × the radioactivity concentration in tissue/injected radioactivity.
Figure 7.

Comparison of time-activity curves in peripheral organs between baseline and after pretreatment with SAHA (1mg/Kg) of [11C]1.
Prior studies have shown that [18F]FAHA has moderate brain penetration which is reduced by treatment with SAHA indicating that radioactivity accumulation in the brain is HDAC-specific14, 15. However, contrary to our prediction, the brain uptake of [11C]3, which only differs from [18F]FAHA by the substitution of a hydrogen atom for the fluorine atom in the acetyl group, was very poor (Figure 4). The difference is not due to different rates of metabolism; the fraction of [18F]FAHA in plasma at 10 minutes post is actually lower than that for [11C]3 (1 % vs 10%) (Figure 8). This can be clearly seen in the plasma AUC’s which clearly show a lower AUC for [18F]FAHA (Figure 8) than for [11C]3. Thus the presence of a fluorine atom has a much larger impact than would be predicted based on their structural similarities. We have made a similar observation for a series of lipophilic [11C]benzamides where the substitution of a fluorine for a hydrogen atom significantly increases brain penetration (unpublished). In addition, when compared with [11C]acetic acid, the brain uptake of [18F]fluoroacetic acid was also 2~3 times higher than that of [11C]acetic acid. Understanding the mechanisms(s) underlying the effect of fluorine substitution on brain penetration is important for CNS drug development and merits further investigation.
Figure 8.

(left panel) % of unchanged (parent) labeled compound in plasma at different times after injection of [11C]1, [11C]3 and [18F]FAHA; (right panel) AUC for [11C]1, [11C]3 and [18F]FAHA.
Based on our results and prior studies, the most important physiological criterion to be optimized for the future development of HDAC radiotracers for brain studies is BBB permeability. In order to set the guideline of each molecular property known to affect BBB permeability, we compared lipophilicity (clogP) and polar surface area (PSA) for known HDAC inhibitors and radioligands as shown in Table 1. Both molecular weight and clogP for all selected compounds were within acceptable ranges, where many conventional PET radiotracers also fall.30 However, the PSA range is broad (73.6–107.1) and relatively high compared with conventional radiotracers. Lower PSA values are known to be associated with higher BBB permeability. For example, in a class-by-class comparison, the PSA of BBB permeable hydroxamate should be lower than that of the lowest PSA hydroxamate, [11C]KB631 which showed little brain uptake.20 In case of HDAC substrates, the PSA of compound [11C]3 is slightly higher than that of [18F]FAHA which has shown suitable BBB permeability14 as a imaging probe. However, this small difference affected the clogBB value (BB is ratio of brain to plasma concentration of drug in steady state) and may affect brain entry rate. Therefore, we suggest that potential acetamide types of HDAC radiotracers should have a PSA ≤ 77.
Table 1.
Calculated molecular descriptors for HDAC inhibitors
| Type | Class | Compound | MWa | clogBB | PSAb | clogPb | |
|---|---|---|---|---|---|---|---|
| Sb | Mc | ||||||
| Inhibitor | Benzamide | [11C]MS-275 | 376.4 | −1.95 | −0.75 | 118.8 | 2.5 (1.79)d |
| Hydroxamate | TSA | 302.4 | −1.60 | −0.48 | 93.1 | 2.2 | |
| SAHA | 264.3 | −1.85 | −0.87 | 102.5 | 1.8 | ||
| [18F]SAHA | 282.3 | −1.75 | −0.85 | 102.5 | 2.0 | ||
| [18F]FESAHA | 310.4 | −1.90 | −0.91 | 102.5 | 2.2 | ||
| [11C]KB631 | 337.4 | −0.19 | −0.17 | 73.6 | 2.5 | ||
| [11C]1 | 279.3 | −1.84 | −0.77 | 101.5 | 2.4 (0.5)d | ||
| [11C]2, M344 | 307.4 | −2.08 | −0.73 | 107.1 | 1.8 | ||
| Subsrate | Acetamide | [18F]FAHA | 266.3 | −0.94 | −0.64 | 77.0 | 1.7 (1.39)d |
| [11C]3 | 248.3 | −1.05 | −0.54 | 77.6 | 1.7 | ||
, molecular weight
, calculated (QuikProp, version 2.0, Schrödinger)
, calculated (MOE, version 2012. 10, Chemical Computing Group)
, measured log D7.4
In summary, we successfully synthesized C-11 labeled trichostatin A derivative, [11C]1, and C-11 version of [18F]FAHA-like HDAC substrate, [11C]3, to evaluate and compare their potential as a HDAC imaging probes. However, their lack of BBB permeability and HDAC-specific signal limited their utility as a CNS radiotracers for HDAC.
Acknowledgments
This work was supported by DOE grant B&R KP1503010 and NIH grant 1R01DA030321. In addition, the work at Brookhaven National Laboratory was performed under contract DEAC02- 98CH10886 with the U.S. Department of Energy, and with infrastructure support from its Office of Biological and Environmental Research. Salary support for SWK and LM was provided by the intramural program of the National Institute on Alcohol Abuse and Alcoholism. We are grateful to the PET radiotracer and imaging team at BNL (Dr. Michael Schueller, David Alexoff, Pauline Carter, Payton King, Barbara Hubbard and Don Warner) for carrying out primate imaging experiments. We used two computational chemistry programs available in the Center for Molecular Modeling (http://cmm.cit.nih.gov) and the Helix Systems (http://helix.nih.gov) at the National Institutes of Health, Bethesda, MD.
Footnotes
Publisher's Disclaimer: This is a PDF file of an unedited manuscript that has been accepted for publication. As a service to our customers we are providing this early version of the manuscript. The manuscript will undergo copyediting, typesetting, and review of the resulting proof before it is published in its final citable form. Please note that during the production process errors may be discovered which could affect the content, and all legal disclaimers that apply to the journal pertain.
Reference and notes
- 1.Muller S, Brown PJ. Clin. Pharmacol. Ther. 2012;92:689. doi: 10.1038/clpt.2012.154. [DOI] [PubMed] [Google Scholar]
- 2.Marmorstein R, Trievel RC. Bba-Gene Regul. Mech. 2009;1789:58. doi: 10.1016/j.bbagrm.2008.07.009. [DOI] [PMC free article] [PubMed] [Google Scholar]
- 3.Li JY, Li GQ, Xu WQ. Curr. Med. Chem. 2013;20:1858. doi: 10.2174/0929867311320140005. [DOI] [PubMed] [Google Scholar]
- 4.Fischer A, Sananbenesi F, Mungenast A, Tsai LH. Trends Pharmacol. Sci. 2010;31:605. doi: 10.1016/j.tips.2010.09.003. [DOI] [PubMed] [Google Scholar]
- 5.Giannini G, Cabri W, Fattorusso C, Rodriquez M. Future Med. Chem. 2012;4:1439. doi: 10.4155/fmc.12.80. [DOI] [PubMed] [Google Scholar]
- 6.Wiech NL, Fisher JF, Helquist P, Wiest O. Curr. Top. Med. Chem. 2009;9:257. doi: 10.2174/156802609788085241. [DOI] [PubMed] [Google Scholar]
- 7.Tsuji N, Kobayashi M, Nagashima K, Wakisaka Y, Koizumi K. J. Antibiot. 1976;29:1. doi: 10.7164/antibiotics.29.1. [DOI] [PubMed] [Google Scholar]
- 8.Yoshida M, Kijima M, Akita M, Beppu T. J. Biol. Chem. 1990;265:17174. [PubMed] [Google Scholar]
- 9.Mann BS, Johnson JR, Cohen MH, Justice R, Pazdur R. Oncologist. 2007;12:1247. doi: 10.1634/theoncologist.12-10-1247. [DOI] [PubMed] [Google Scholar]
- 10.Day JJ, Sweatt JD. Neuron. 2011;70:813. doi: 10.1016/j.neuron.2011.05.019. [DOI] [PMC free article] [PubMed] [Google Scholar]
- 11.Warnault V, Darcq E, Levine A, Barak S, Ron D. Transl. Psychiatr. 2013:3. doi: 10.1038/tp.2013.4. [DOI] [PMC free article] [PubMed] [Google Scholar]
- 12.Kim SW, Hooker JM, Otto N, Win K, Muench L, Shea C, Carter P, King P, Reid A, Volkow N, Fowler JS. Nucl. Med. Biol. 2013 doi: 10.1016/j.nucmedbio.2013.06.007. Accepted. [DOI] [PMC free article] [PubMed] [Google Scholar]
- 13.Mukhopadhyay U, Tong WP, Gelovani JG, Alauddin MM. J. Labelled Compd. Radiopharm. 2006;49:997. [Google Scholar]
- 14.Reid AE, Hooker J, Shumay E, Logan J, Shea C, Kim SW, Collins S, Xu YW, Volkow N, Fowler JS. Nucl. Med. Biol. 2009;36:247. doi: 10.1016/j.nucmedbio.2008.12.005. [DOI] [PMC free article] [PubMed] [Google Scholar]
- 15.Yeh HH, Tian M, Hinz R, Young D, Shavrin A, Mukhapadhyay U, Flores LG, Balatoni J, Soghomonyan S, Jeong HJ, Pal A, Uthamanthil R, Jackson JN, Nishii R, Mizuma H, Onoe H, Kagawa S, Higashi T, Fukumitsu N, Alauddin M, Tong W, Herholz K, Gelovani JG. Neuroimage. 2013;64:630. doi: 10.1016/j.neuroimage.2012.09.019. [DOI] [PMC free article] [PubMed] [Google Scholar]
- 16.Hendricks JA, Keliher EJ, Marinelli B, Reiner T, Weissleder R, Mazitschek R. J. Med. Chem. 2011;54:5576. doi: 10.1021/jm200620f. [DOI] [PMC free article] [PubMed] [Google Scholar]
- 17.Zeglis BM, Pillarsetty N, Divilov V, Blasberg RA, Lewis JS. Nucl. Med. Biol. 2011;38:683. doi: 10.1016/j.nucmedbio.2010.12.008. [DOI] [PMC free article] [PubMed] [Google Scholar]
- 18.Simonini MV, Camargo LM, Dong E, Maloku E, Veldic M, Costa E, Guidotti A. Proc. Natl. Acad. Sci. USA. 2006;103:1587. doi: 10.1073/pnas.0510341103. [DOI] [PMC free article] [PubMed] [Google Scholar]
- 19.Hooker JM, Kim SW, Alexoff D, Xu YW, Shea C, Reid A, Volkow N, Fowler JS. Acs Chem. Neurosci. 2010;1:65. doi: 10.1021/cn9000268. [DOI] [PMC free article] [PubMed] [Google Scholar]
- 20.Shuiyu L, Zhang Y, Kalin J, Liow J-S, Gladding RL, Innis RB, Koziokowski AP, Pike VW. J. Labelled Compd. Radiopharm. 2013;56:S318. [Google Scholar]
- 21.Woo SH, Frechette S, Abou Khalil E, Bouchain G, Vaisburg A, Bernstein N, Moradei O, Leit S, Allan M, Fournel M, Trachy-Bourget MC, Li ZM, Besterman JM, Delorme D. J. Med. Chem. 2002;45:2877. doi: 10.1021/jm020154k. [DOI] [PubMed] [Google Scholar]
- 22.Remiszewski SW, Sambucetti LC, Atadja P, Bair KW, Cornell WD, Green MA, Howell KL, Jung M, Kwon P, Trogani N, Walker H. J. Med. Chem. 2002;45:753. doi: 10.1021/jm015568c. [DOI] [PubMed] [Google Scholar]
- 23.Solbach C, Uebele M, Reischl G, Machulla HJ. Appl. Radiat. Isot. 2005;62:591. doi: 10.1016/j.apradiso.2004.09.003. [DOI] [PubMed] [Google Scholar]
- 24.Tang WP, Luo TP, Greenberg EF, Bradner JE, Schreiber SL. Bioorg. Med. Chem. Lett. 2011;21:2601. doi: 10.1016/j.bmcl.2011.01.134. [DOI] [PMC free article] [PubMed] [Google Scholar]
- 25.Ho CY, Strobel E, Ralbovsky J, Galemmo RA. J. Org. Chem. 2005;70:4873. doi: 10.1021/jo050036f. [DOI] [PubMed] [Google Scholar]
- 26.Hogberg T, Strom P, Ebner M, Ramsby S. J. Org. Chem. 1987;52:2033. [Google Scholar]
- 27.Hooker JM, Schoenberger M, Schieferstein H, Fowler JS. Angew. Chem. 2008;47:5989. doi: 10.1002/anie.200800991. [DOI] [PMC free article] [PubMed] [Google Scholar]
- 28.Hooker JM, Xu YW, Schiffer W, Shea C, Carter P, Fowler JS. Neuroimage. 2008;41:1044. doi: 10.1016/j.neuroimage.2008.03.003. [DOI] [PMC free article] [PubMed] [Google Scholar]
- 29.Pike VW. Trends Pharmacol. Sci. 2009;30:431. doi: 10.1016/j.tips.2009.05.005. [DOI] [PMC free article] [PubMed] [Google Scholar]
- 30.Mathis CA, Wang YM, Holt DP, Huang GF, Debnath ML, Klunk WE. J. Med. Chem. 2003;46:2740. doi: 10.1021/jm030026b. [DOI] [PubMed] [Google Scholar]