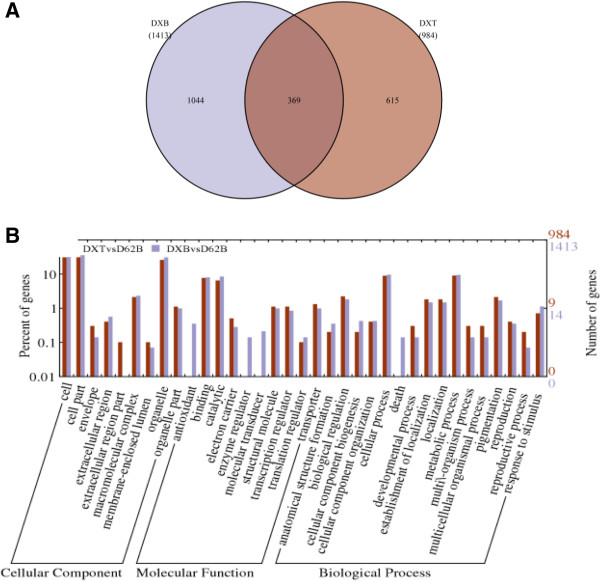
Figure 3.

Comparative analysis of the DEGs in DXT and DXB with respect to D62B. (A) Venn diagram for the numbers of DEGs in DXT and DXB. (B) GO functional categories of the DEGs in DXT and DXB. The y-axis on the right indicates the number of genes in a category, and the y-axis on the left is the percentage of genes to be analyzed in a category. DXT: transgenic line with Xa21; DXB: MAB line with Xa21; D62B: the common parental line of DXT and DXB.
