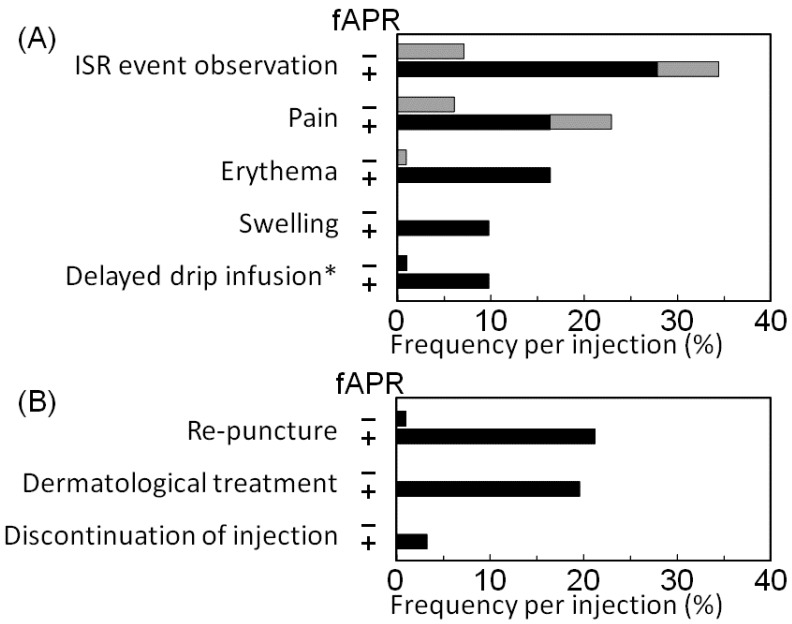
Figure 3.
Clinical symptoms (A) and managements of ISR (B). The frequency of (A) clinical symptoms and (B) managements of ISR was assessed for 61 injections in the fosaprepitant group and 98 injections in the control group. Black bars represent the frequency of symptoms or managements together with treatment-required ISR, and gray bars represent the frequency of clinical symptoms or managements together with non-treatment required ISR. * depicts the phenomenon observed without the handle of clinical staffs. ISR, injection site reaction; and fAPR, fosaprepitant.

