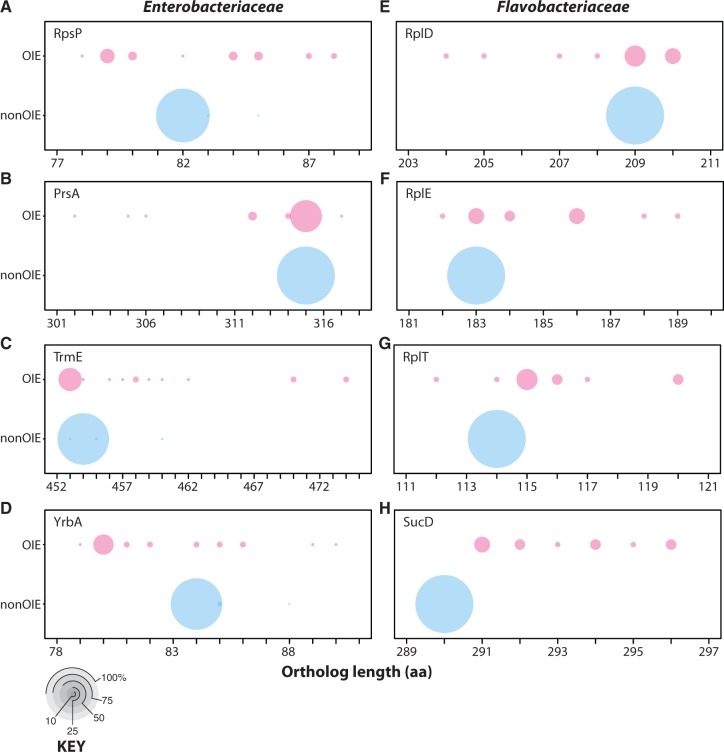
Fig. 5.—
Bubble plots of orthologous proteins representing proteins with OIE lengths more variable than nonOIE lengths. The x-axis depicts protein length in amino acid residues. The bubbles are scaled by the number of proteomes with a protein at a particular length out of the total number of proteomes. Each table is labeled with the orthologous protein set it represents. The key shows what various proportions look like as bubbles. X-axis values are the ortholog lengths in number of amino acid residues.

