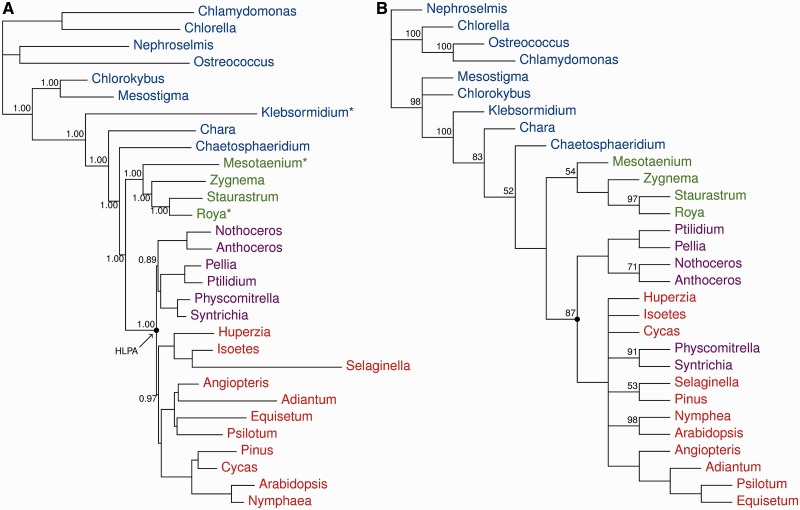
Fig. 4.—
Phylogenetic analyses. (A) Bayesian MCMC phylogenetic analyses of 83 protein-coding chloroplast genes: PhyloBayes CAT + gcpREV + Γ, marginal likelihood: −Lh = 244,645.3855. (B) Strict consensus tree of six most parsimonious trees (length 239, consistency index = 0.243, retention index = 0.786) resulting from analysis of the structural data (gene and intron content, operon structure). Numbers at nodes are posterior probabilities and nonparametric bootstrap values for (A) and (B), respectively. The nodes representing the HLPA are highlighted.

