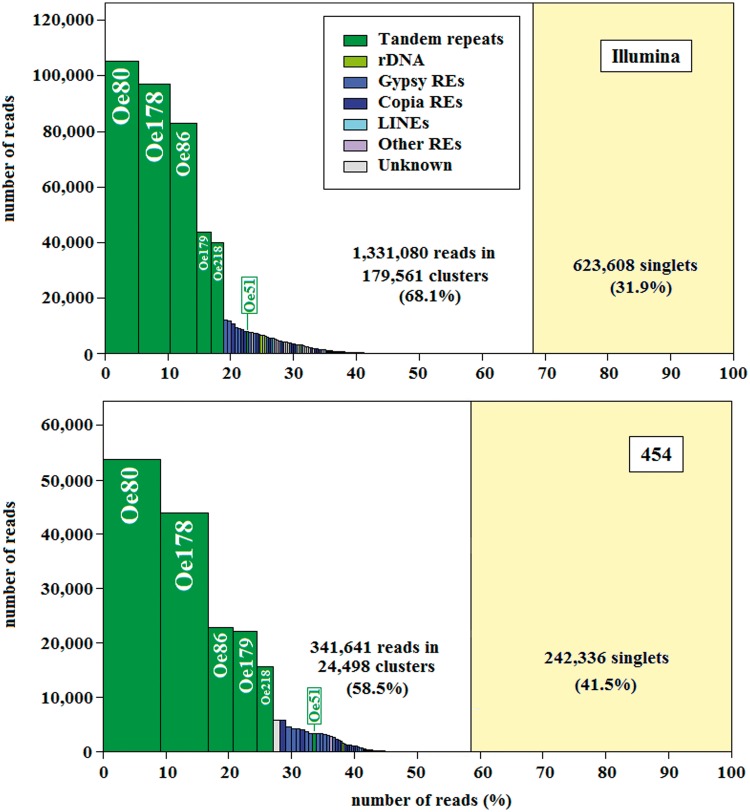
Fig. 1.—
Repeat abundance based on one genome equivalent of Illumina (top) and 454 reads (bottom) clustered using RepeatExplorer (see Materials and Methods). Each bar in the histograms shows the individual size (height) of each cluster and the size relative to the total (width). The composition of each cluster is indicated by color, and single-copy, unclustered sequences are reflected to the right of the vertical bar. For the most redundant clusters, the annotation is reported within the bar.

