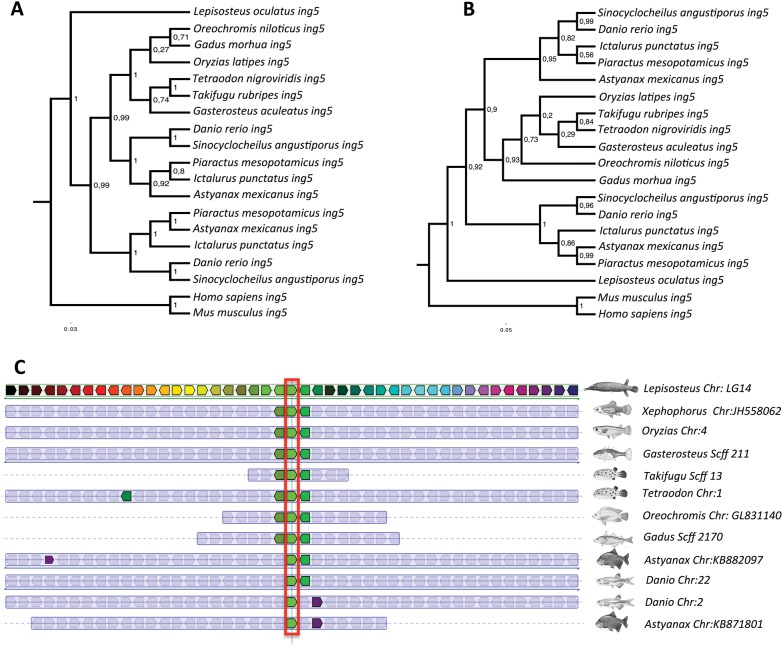
Fig. 3.—
Phylogenetic (A, B) and synteny (C) analysis for LSP from Ostariophysi species. (A) Phylogenetic relationships for the inhibitor of growth protein 5 (ing5) gene. Tree node values represent posterior values. (B) Maximum likelihood phylogenetic relationships for ing5. Phylogenetic trees nodes values represent posterior values. (C) Synteny of the Ostariophysi LSP of ing5 across teleost species. Genes are indicated as colored boxes, and orthologs share the same color. To aid interpretation, ing5 orthologs were aligned and are highlight in red.

