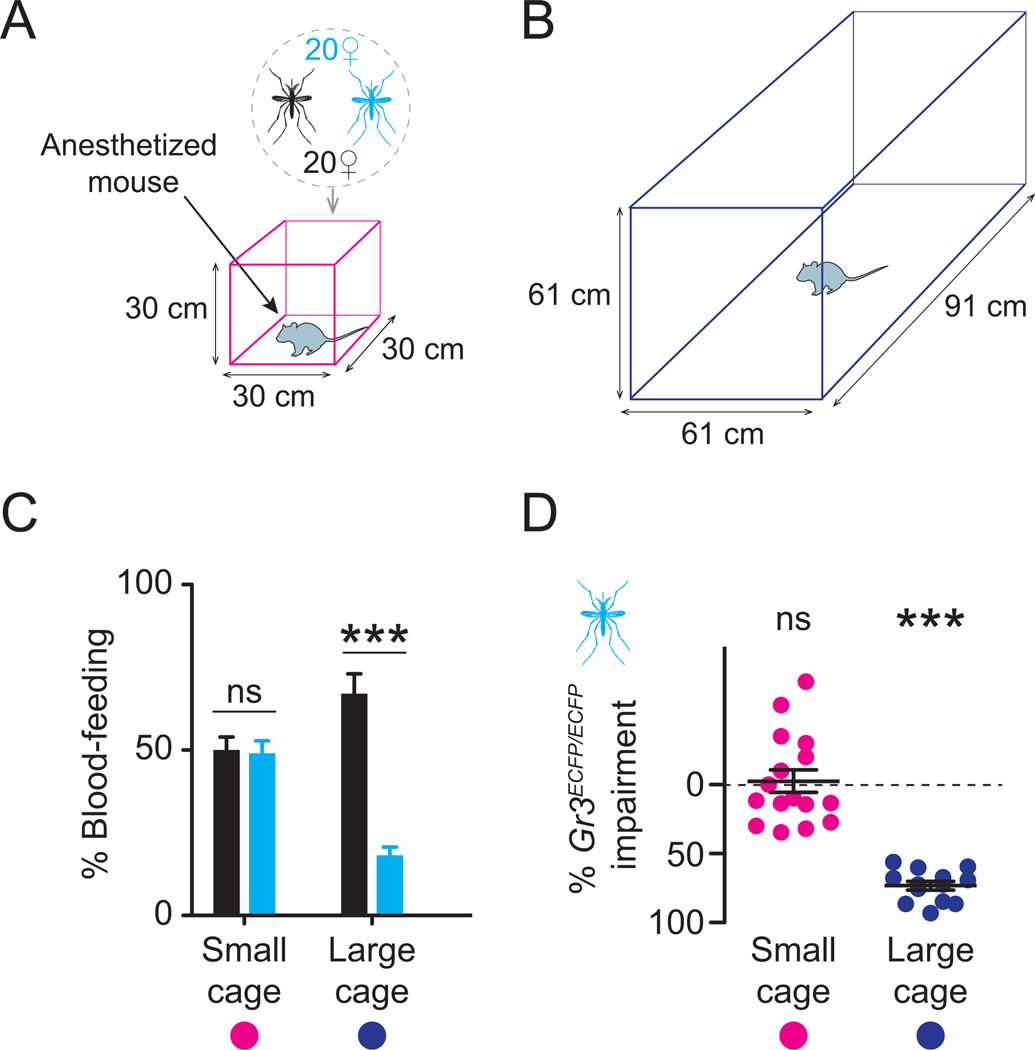
Figure 6. Spatial scale-dependent responses of Gr3 mutants to live animal hosts.
(A–B) Diagrams of small (A) and large (B) cage assays.
(C–D) Per cent blood-feeding of the indicated genotype (C) and impairment of Gr3ECFP/ECFP mutants relative to wild-type (D).
Significance was assessed in C with paired t-tests and in D with a one-sample t-test relative to zero (ns, not significant; *** p < 0.001).
All data are plotted as mean ± s.e.m (small cage: n=16 trials; large cage: n=13 trials; n=20 mosquitoes/genotype/trial).

