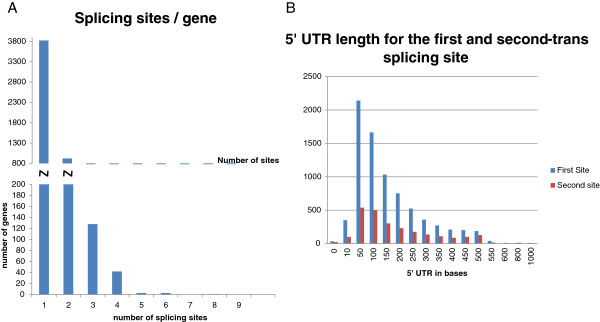
Figure 5.

Distribution of the number of trans-splicing sites and 5′UTR lengths. A. Number of splicing sites per gene. B. Histogram of 5′UTR lengths to the first (FTSS) and second trans-splicing site (STSS). 5′UTR lengths average values 132 nts and 164 nts for FTSS and STSS respectively.
