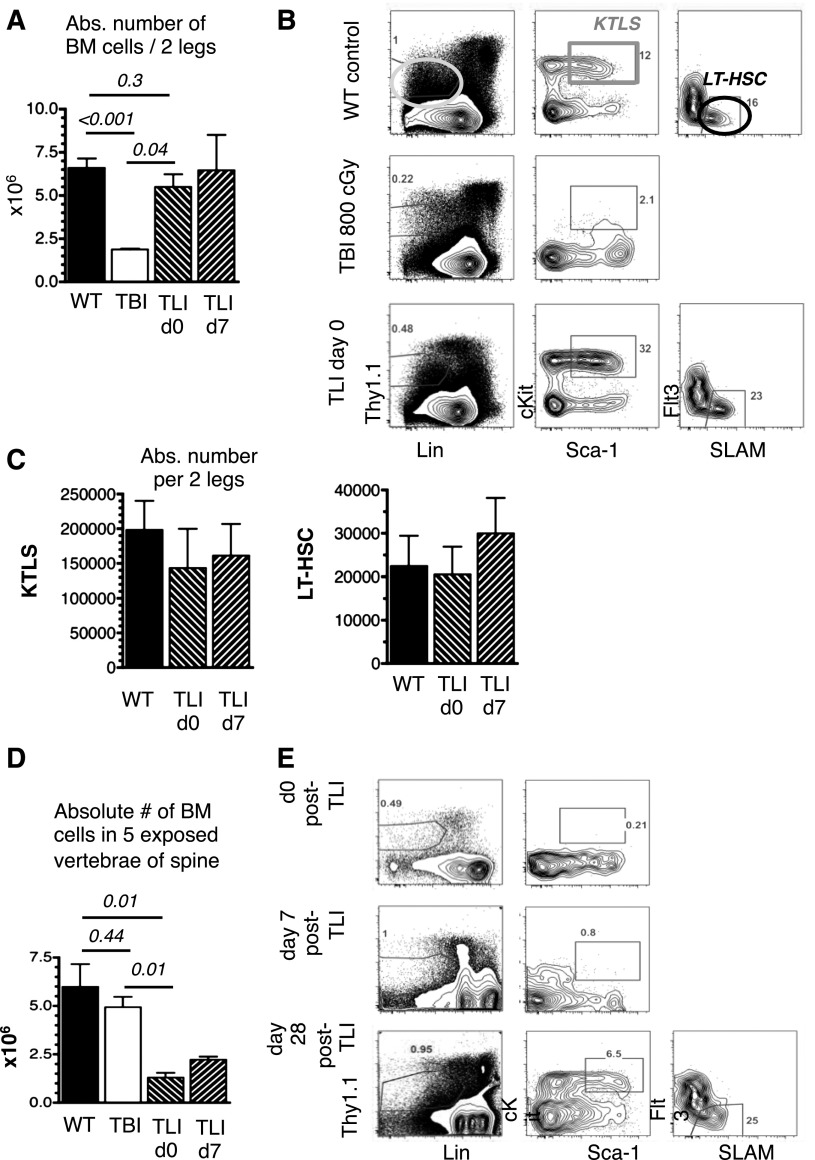
Figure 2.
Nonimmune barriers remain after TLI/ATG. BM cells of 2 legs and 5 vertebrae of the spine from untreated WT mice, 24 hours after lethal TBI and 24 hours and 7 days after TLI/ATG were counted and analyzed by FACS for HSC-content. (A) Compiled data on absolute cell numbers per 2 legs following TBI, compared with WT and TLI/ATG-treated mice. (B) Representative FACS plots of a WT mouse (top panel) displaying the gating strategy for LinnegThy1.1low (left), cKit+Sca-1high KTLS-HSC (middle), and LT-HSC (right; KTLS-Flt3-SLAM+); a TBI-treated mouse (middle panel) lacking the KTLS-HSC population; and a TLI/ATG-conditioned mouse (bottom panel) with HSC and progenitor phenotypes resembling WT marrow. (C) Compiled data on calculated absolute numbers of KTLS-HSC (left) and LT-HSC (right) per 2 legs were similar in WT and TLI/ATG-treated mice. Due to the lack of phenotypic KTLS-HSC after TBI conditioning, no absolute numbers for this group are displayed. (D) Compiled absolute cell counts in 5 vertebrae of the spine revealing lower cell numbers in TLI/ATG-treated mice compared with TBI and WT controls, with hypocellularity persisting until day +7 post-TLI/ATG. (E) FACS analysis from vertebral BM of representative TLI/ATG-conditioned mice showing absence of the KTLS-HSC population at 24 hours (top) and day +7 post-TLI/ATG (middle), but reconstitution of phenotypically normal KTLS-HSC and LT-HSC populations by day +28 (bottom). N = 4 to 8 animals per experimental group.

