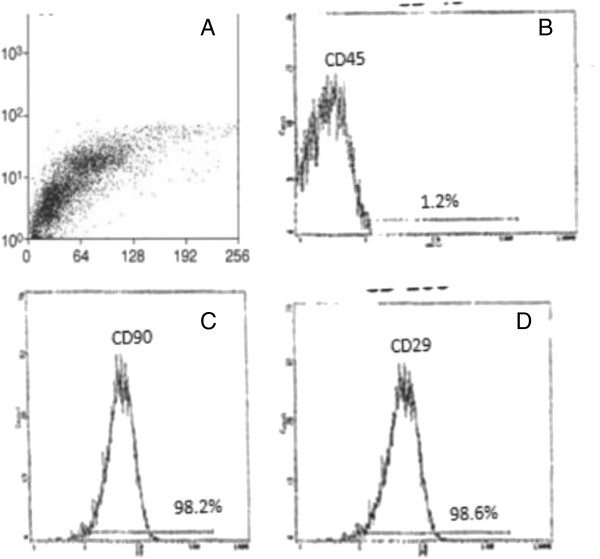
Figure 2.
Characteristics of BM-MSCs. Cells were stained with the CD45, CD90 &CD29 antibody and analyzed by flow cytometry. BM-MSCs are shown as a dot plot (A). The expression levels of CD45-ve (B), CD90 + ve (C) & CD29 + ve (D) of BM-MSCs are presented as a histogram. The percentage of expression of the indicated markers was defined in the figure.

