
Figure 4.
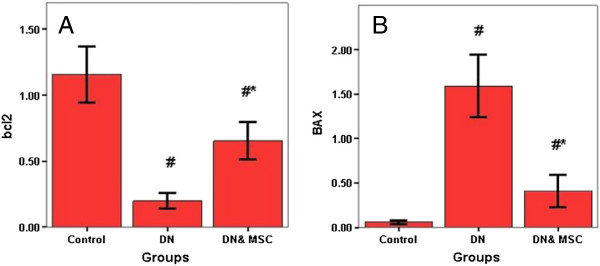
Quantitave analysis of bcl2 (A), bax (B) gene expression by real time PCR in different groups. # Significant p as compared to control group (P = 0.001). * Significant p as compared to DN group (P = 0.001).
Official websites use .gov
A
.gov website belongs to an official
government organization in the United States.
Secure .gov websites use HTTPS
A lock (
) or https:// means you've safely
connected to the .gov website. Share sensitive
information only on official, secure websites.
Quantitave analysis of bcl2 (A), bax (B) gene expression by real time PCR in different groups. # Significant p as compared to control group (P = 0.001). * Significant p as compared to DN group (P = 0.001).